Push Custom Data in Your Dashboards With CSV Files

Everyday, you’re dealing with data coming from multiple sources: analytics and SEO tools, social media platforms, email services, etc. It can get a little messy. We’re here to make everything easier, more organized, and faster; we support over 30 integrations to help you gather all your data into one comprehensive dashboard. Find the ones you need!
What? The one you’re looking for isn’t on our list?
Don’t worry, we’ve got your back! One of our favorite reporting hacks is using CSV files. You can integrate pretty much any type of custom data with this method. And because we really love making things simple, we’ve added a second hack to our reporting hack: you just need to set up your CSV files once, and they’ll be automatically updated after that!
Simple and custom – that’s how we roll!
I – Create a CSV file
A) Know what it is
A CSV file is basically an Excel file that was exported in a Comma Separated Values format. It’s a file that consists of only rows and columns: plain data without any formatting. This format is pretty standard amongst tools that allow for data exportation.
Here’s how it looks:
2013-10-31
ACME
Campaign,Impressions,Clicks,Cost,CTR
Halloween,1000,20,100,00,0.02
Fall2013,5000,75,200,00,0,0.15
B) Create your template
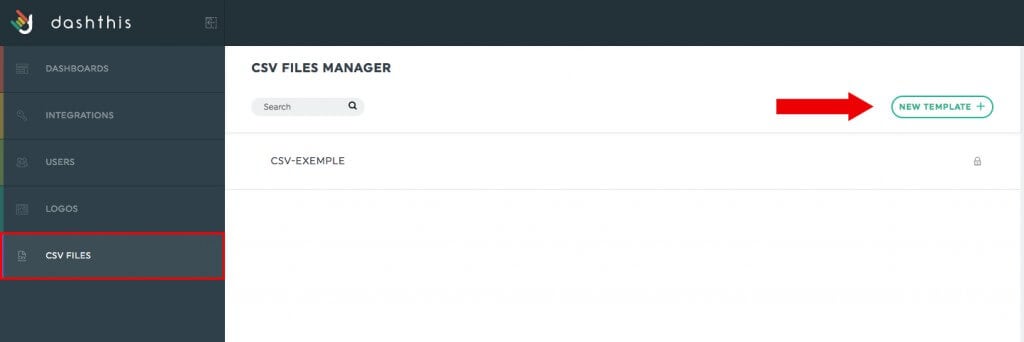
In the app, go into the CSV Files Manager and create a new template. By having a template, you won’t have to repeat the process every time you upload a new CSV file. The system will automatically know that your new CSV file matches this template.
Choose your CSV file and upload it. You should see something like this:
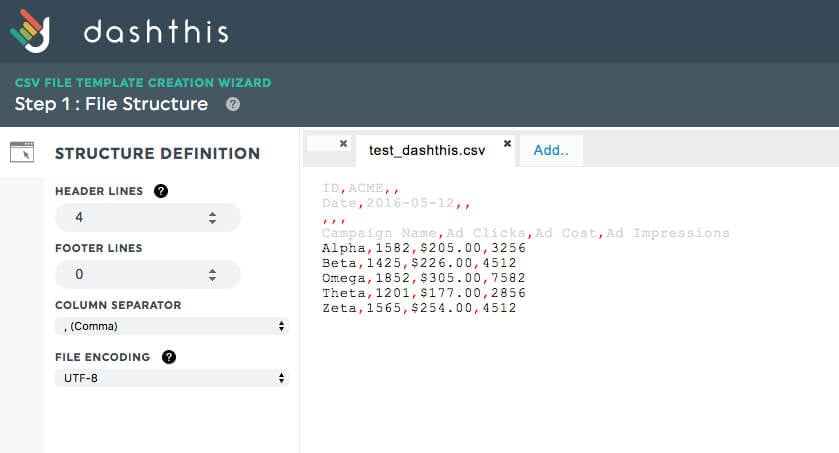
The tool now needs a bit more information about the specific file structure, particularly the number of lines in the headers, including the lines containing the column names.
You also need to specify the number of lines in the footer (if any), including the lines displaying totals. Enter the column separator (be it a comma or semicolon), and the file encoding. You can, of course, use default values. If you want more information, we have an article in our Help Center dedicated to this process!
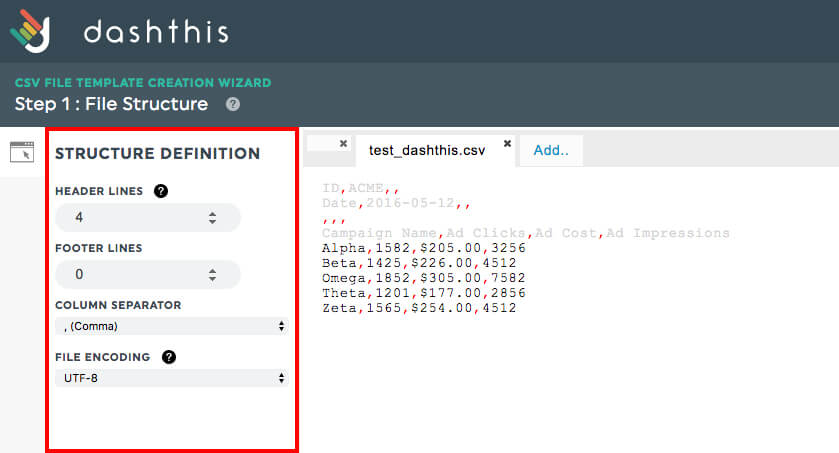
Done with the file structure? Let’s move on! Click Next to get to the next steps.
C) Define the fields
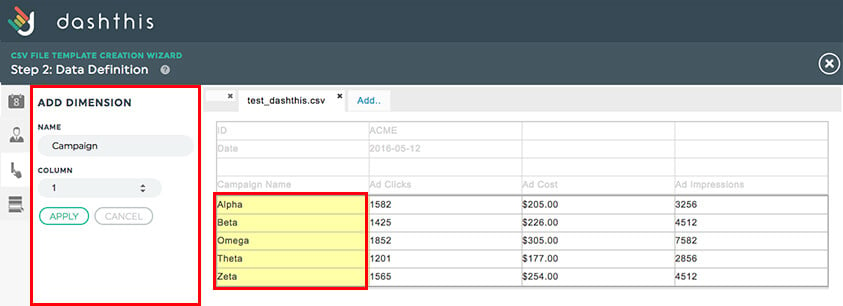
It’s now time to define the date, the customer field, the metrics, and the dimensions. This is your way to tell the system where it can find each piece of information in the file. If the piece of information is located within either the header, the second column, or the second line, you should enter the number “2” in both fields.
Have a look:
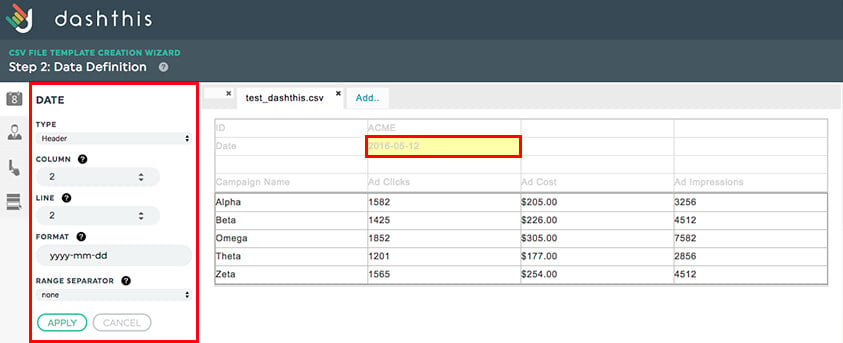
Why do we have to define a Customer ID and a date?
It’s important to define both a Customer ID and a date because these pieces of information tell the system the dashboard and period in which the data should appear. If you create one file for multiple customers and with multiple dates, the system will know exactly where and when the data should go thanks to the customer ID and date. This also applies if your file only contains one customer and one date.
Done? Click Save! Give your template a name, and there you go, your CSV file template is created!
II – Create a dashboard with a CSV data source
A) Connect the data source
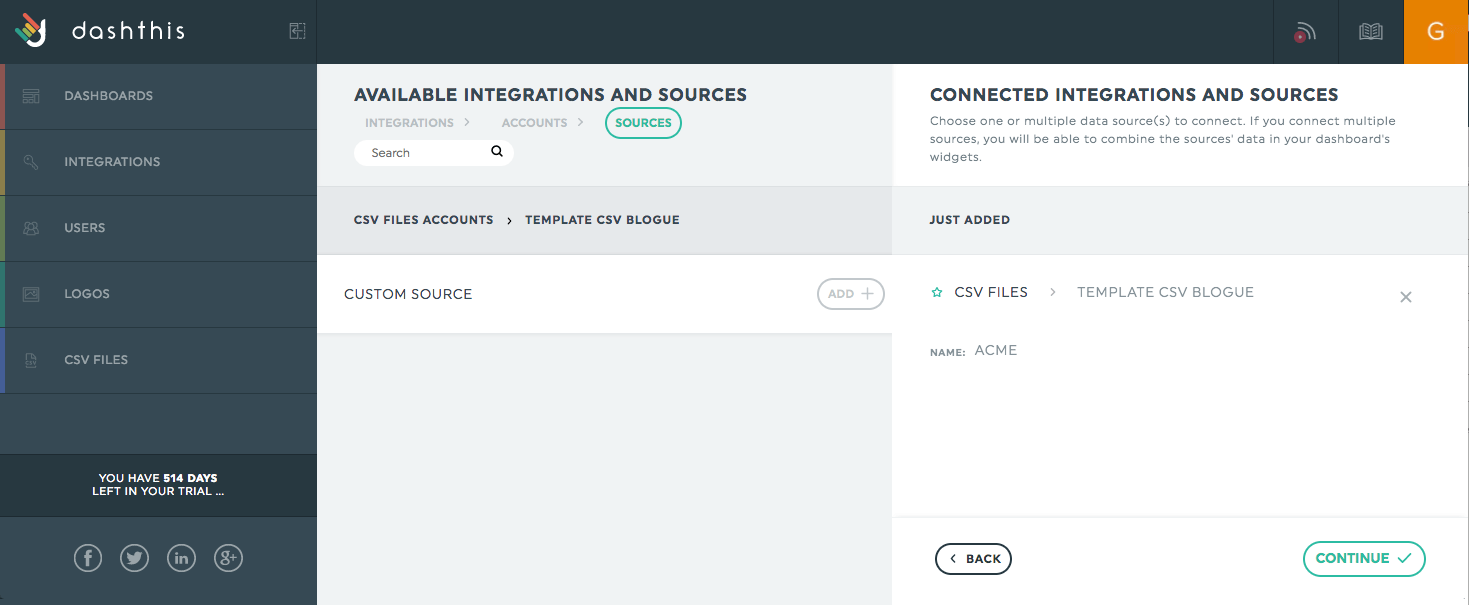
How about we create a dashboard with this CSV file then, hmm? As with any other data source you might want to use, you’ll see the CSV file in your Integration Manager.
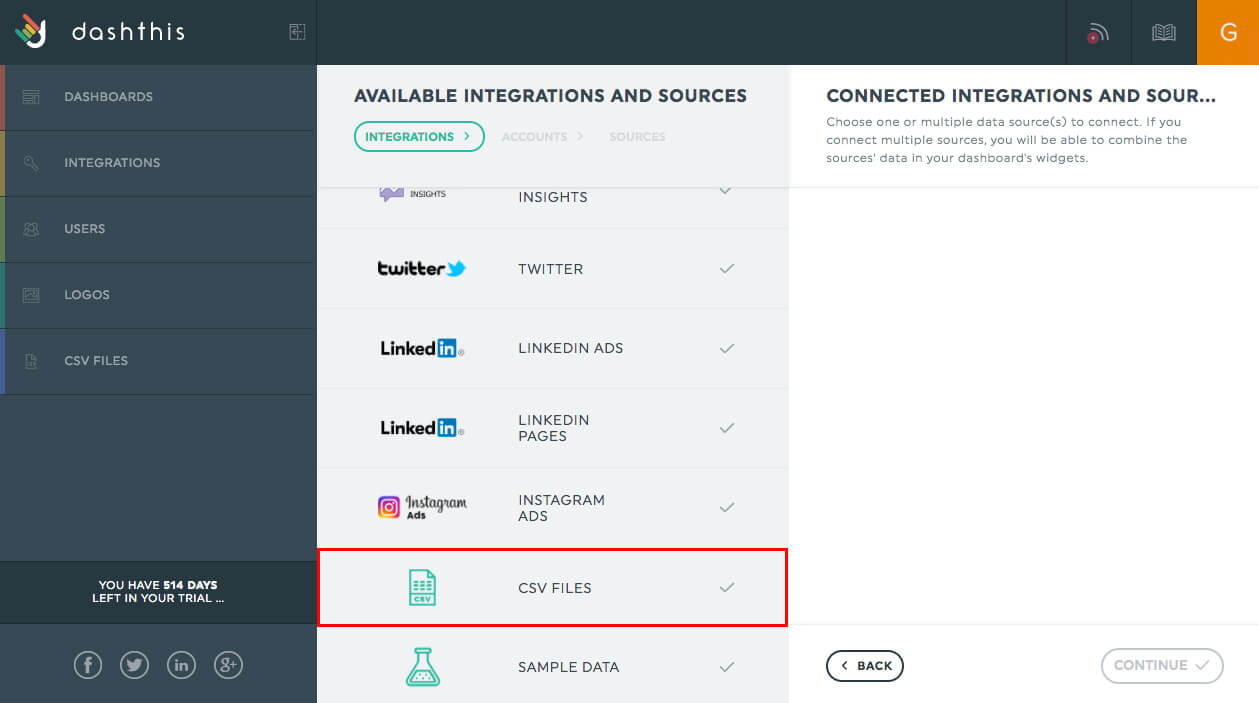
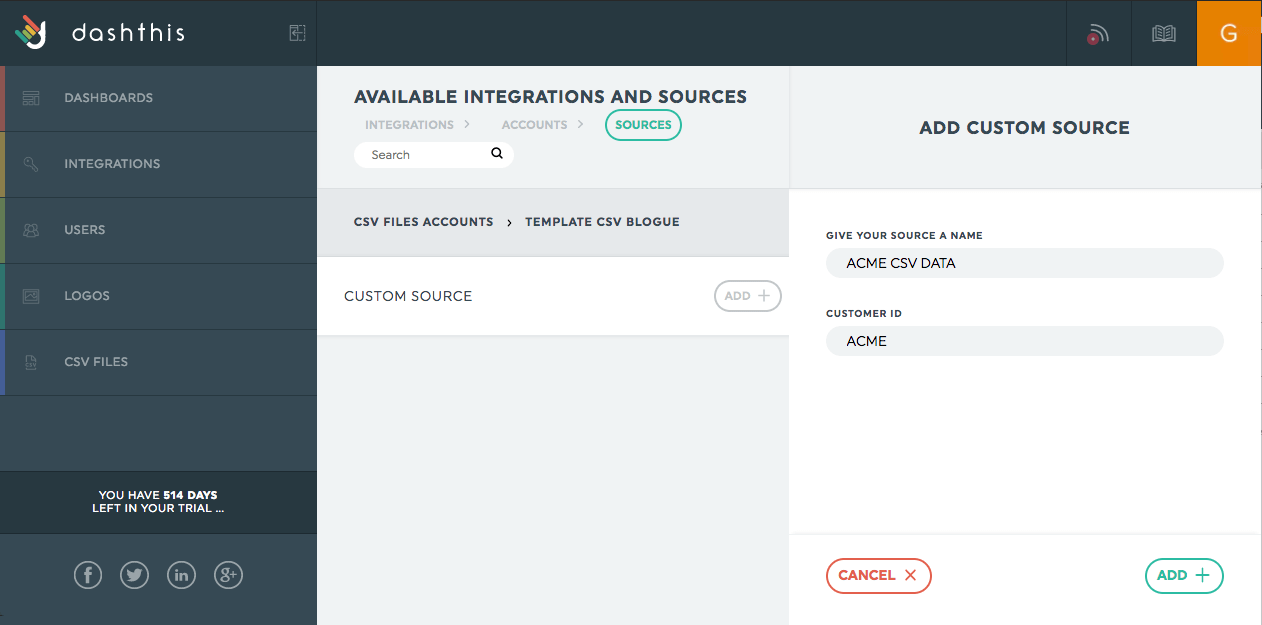
To add a source, you have to specify a key. Remember the Customer ID field you entered before? This is where it goes! The system will filter the right data according to the Customer ID. As for the name, it’s up to you! Just remember, the name is used to display the data source in the system.
B) Add KPIs to your dashboard
Now that your data is there, it’s time to decide precisely what numbers you want to show and how you want to show them by adding widgets. You can choose among our preset widgets or use the custom widgets to select the metrics and dimensions you want!
C) Push the data
Once you’ve created your widgets, you just need to upload the CSV file in order to send the right data to your widgets. It’s important to note that if you add new widgets to your dashboard, you’ll have to upload the file again. However, remember: as long as your dashboard stays the same with the same widgets, you’ll never have to re-upload your CSV file again… it will update itself automatically!
There you go! You just created an awesome dashboard with entirely custom data!

When the time comes to create your dashboard, having all your data together is crucial to have the whole picture and then to make the best decisions. If you can’t find what you’re looking for in our list of over 30 integrations, CSV files are the little something extra that will bring all your data together.
We know that using a CSV file system might seem scary, but it really isn’t. As soon as you upload it once, it’s all there and you use it as you would any other integration, since it updates itself. It’s like talking to new people: you just need to break the ice to discover how awesome it is!
If you’re still manually creating your dashboards (a.k.a spending way too much time) and your computer contains countless Excel files, give DashThis a try for free! Custom data sources don’t need to be a pain! With DashThis, automated reporting has never been so customizable.
Ready to automate your reporting?
Read More
Don’t miss out!
Automate your reports!
Bring all your marketing data into one automated report.
Try dashthis for free

