KPI Report: What It Is, 4 Examples, and How to Create One
Key takeaways
- A KPI report presents your most important metrics in one visual, shareable place.
- KPI reporting is the ongoing process of tracking those metrics and sharing them on a set schedule.
- The right KPIs depend on your goals: marketing, SEO, sales, and social each have their own.
- Building one manually in spreadsheets is slow and breaks easily; an automated tool keeps it current.
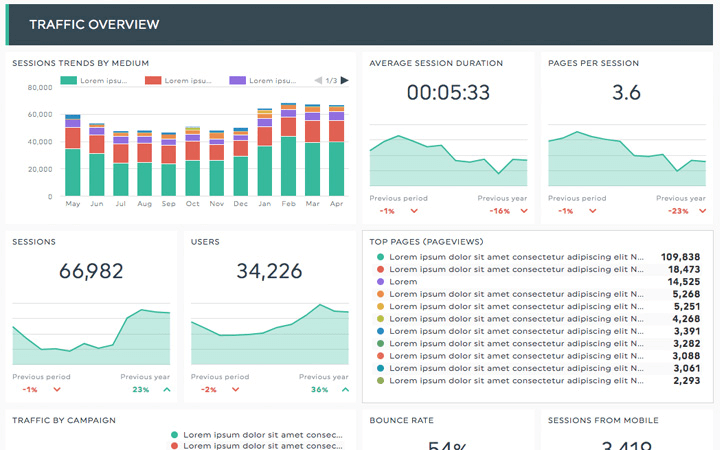
A KPI report is a document that brings together the key performance indicators most important to your business and presents them with data visualisations like graphs and charts.
It shows, at a glance, whether you are on track to hit your goals. A good KPI report is interactive, updates automatically, and is tailored to the person reading it, whether that is your boss, a stakeholder, or a client.
Use this KPI report with your data
What is a KPI report
A KPI report is a document filled with the right key performance indicators for your business, presented visually so the data is easy to read and act on. Each report can cover a specific time period and a specific set of KPIs, and it usually goes to a decision-maker: your manager, a stakeholder, a project team, or a client.
Key performance indicators are the metrics that tell you how well you are attaining your business goals. They differ from ordinary metrics: metrics track the status of a process, while KPIs are the small set of metrics that actually reflect progress toward your objectives. Every KPI on a report should be actionable and tied to a goal.
What is KPI reporting?
KPI reporting is the ongoing practice of tracking your key performance indicators and sharing them on a regular schedule, usually monthly. A monthly cycle is the sweet spot for most marketers: it gathers enough data to be meaningful while staying recent enough to act on. Done well, KPI reporting replaces manual spreadsheet updates with a live report that refreshes on its own.
How to choose the right KPIs
Start with your strategic goals, then work backwards to the metrics that measure them. Ask what you are trying to improve this quarter: a social media campaign, a PPC strategy, organic growth, or revenue. The KPIs you track should map directly to that objective, and nothing else needs to be on the report.
Common categories to draw from include:
- Financial KPIs, such as profit margin and operational cash flow
- Sales KPIs, such as revenue, cost per transaction, and customer lifetime value
- Marketing KPIs, such as conversion rate, ROI, and cost versus revenue
- Customer satisfaction KPIs, such as retention and churn rate
KPI report examples by channel
Below are four KPI report examples. These templates include KPI examples and important metrics to track for each of those particular types of reports. Of course, these are just suggestions that we think could give you some ideas for your own KPI reports, but it's of utmost importance to customize these reports with your own business goals in mind.
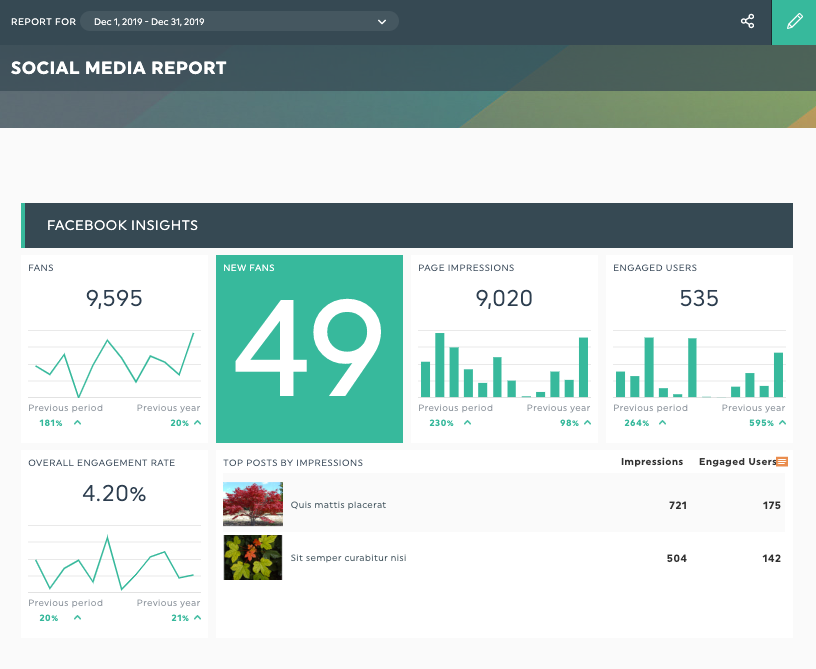
1. Social media KPI report template
See this example live | Use this template with your data
A social media KPI report tracks awareness and engagement across your channels. Useful KPIs include:
- Followers, fans, or subscribers
- Engagement rate (comments, likes, shares)
- Reach and impressions
- Clicks and click-through rate (CTR)
2. SEO KPI report template
See this example live | Use this template with your data
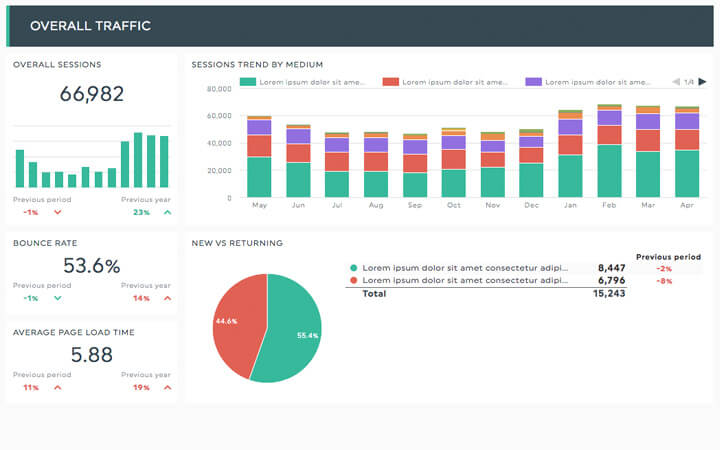
An SEO KPI report shows how your organic search performance is trending. Useful KPIs include:
- Organic sessions (traffic, bounce rate, pages per visit)
- Top organic landing pages
- Organic conversion rate
- Top organic keywords and keyword rankings
- Backlinks and referring domains
3. Ecommerce KPI report template
See this example live | Use this template with your data
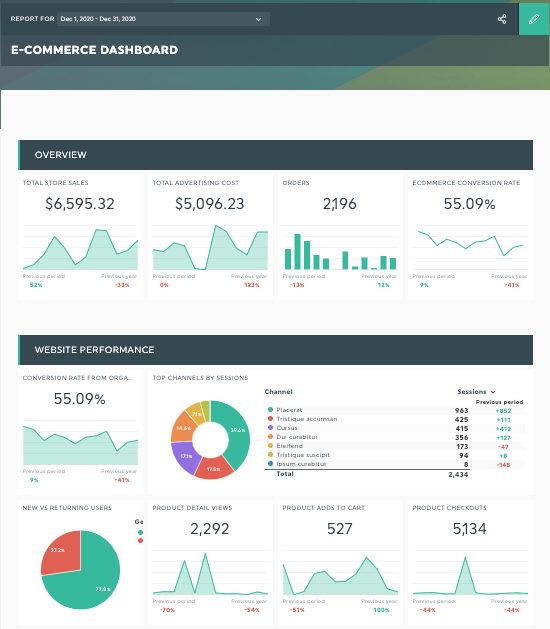
An ecommerce KPI report focuses on revenue and sales performance. Useful KPIs include:
- Number of transactions
- Revenue and product sales
- Conversion rate by channel
- Cart abandonment rate
- Customer lifetime value
4. Digital marketing KPI report template
See this example live | Use this template with your data
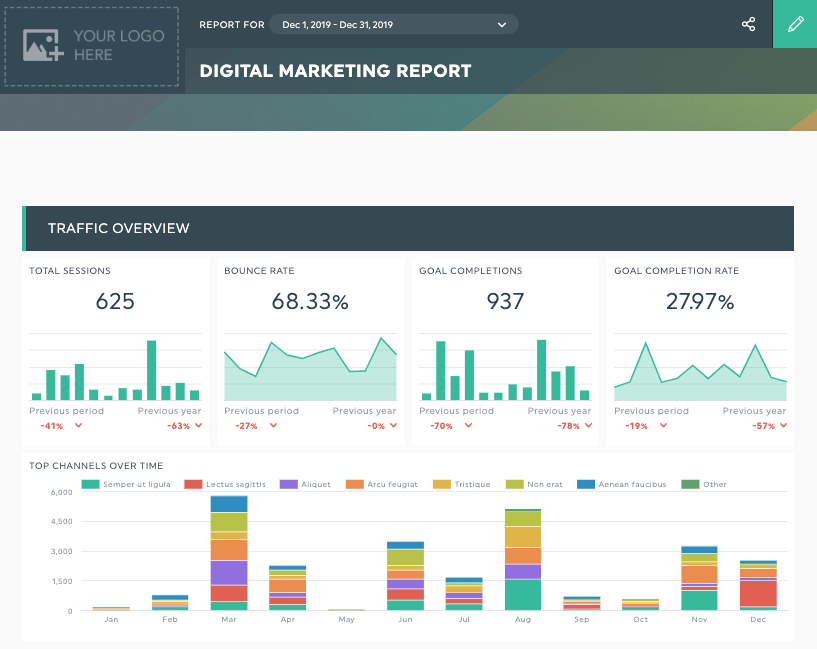
A digital marketing KPI report gives a cross-channel view of overall performance. Useful KPIs include:
- Conversion rate and goal completions
- Campaign performance
- Channel performance by traffic source
- Bounce rate
- Performance by landing page
How to create your KPI report in 5 steps
Once you know which KPIs matter, here is how to gather them into one automated report.
It's quite easy, here are the 5 steps:
1. Decide which KPIs to track
Note your business objective and the handful of KPIs that show whether you are on track to reach it. Keep the list tight and actionable.
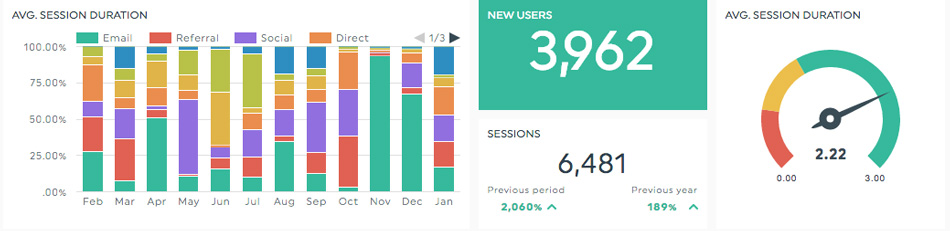
2. Create your DashThis trial
It is free for 14 days, and you can build up to 10 dashboards during the trial.
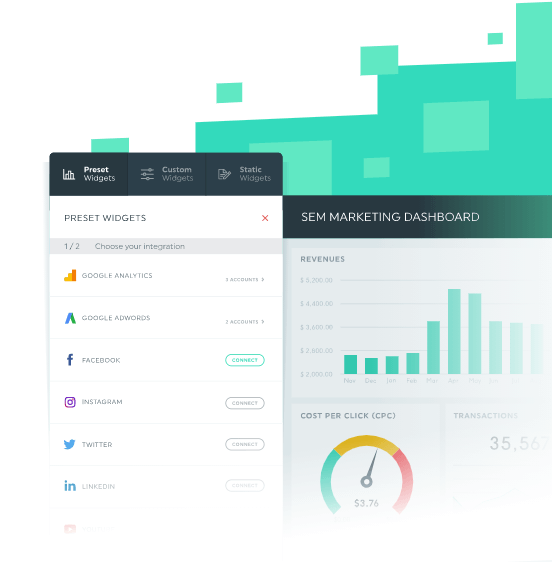
3. Connect your integrations
Choose the platforms you want to pull data from, such as Facebook, Google Ads, Google Analytics, Instagram, Semrush, or Ahrefs. You can also connect Google Sheets or a CSV file for any other data.
4. Build your report
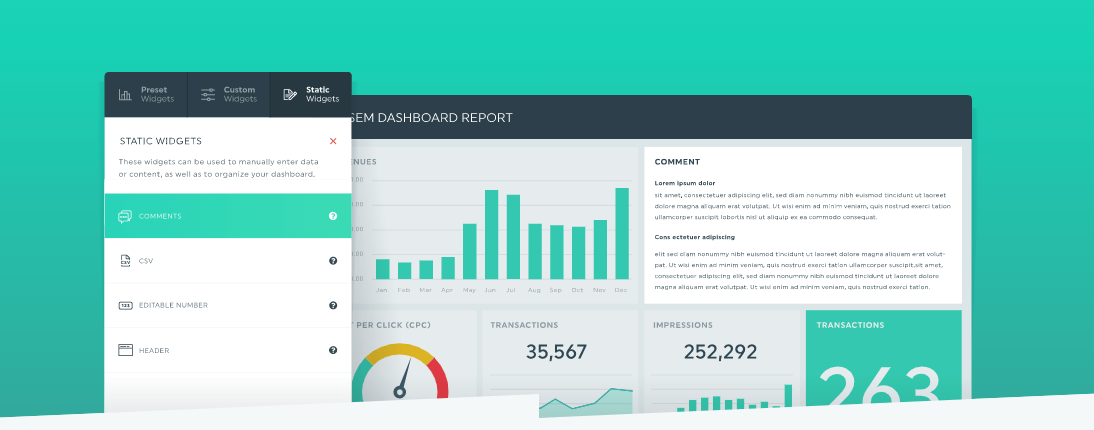
Start from one of the preset report templates or from scratch. Drag and drop the widgets you need, and add comments to give the numbers context. You can also use AI Insights to analyse your data automatically and surface wins, opportunities, and issues across your dashboards.
5. Share it automatically
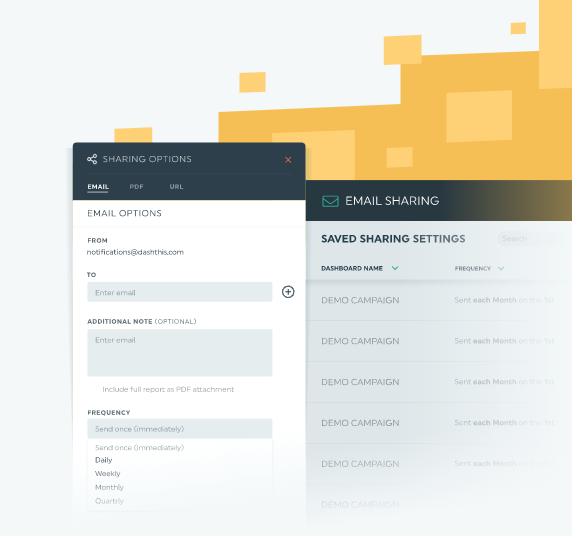
Add your boss, client, or team to the automated email dispatch so they receive an updated report every day, week, month, or year, whichever you choose.
That is it. Your KPI report will refresh on its own from then on.
Create your own KPI report today
Stop rebuilding reports by hand every month. Connect your tools once and let your KPI report update itself.

Ready to automate your reporting?
Read More
Don’t miss out!
Follow us on social media to stay tuned!


Automate your reports!
Bring all your marketing data into one automated report.
Try dashthis for free