How to Track, Measure, and Understand Your Digital Advertising Metrics With DashThis

Digital advertising metrics act as progress indicators that your campaigns are on the right track, but which metrics should you track and why?
The problem isn't a lack of data, but it's knowing what to focus on. This guide walks you through a simple, repeatable method for choosing the right metrics for your digital advertising goals and analyzing and reporting them with DashThis.
- What are digital advertising metrics?
- Why measuring the right metrics matters
- The top digital advertising metrics that matter
- How to track and visualize digital ad metrics in DashThis
- Choose DashThis to help you measure and report on the right digital advertising metrics
What are digital advertising metrics?
Digital advertising metrics are data points that show how your pay-per-click (PPC) campaigns, TikTok, Meta, and LinkedIn ads perform. Each metric measures a specific aspect of your campaign performance, providing the feedback you need to make data-driven decisions for your marketing strategy.
Let’s look at a quick example. A small auto dealer hires you to bring in more qualified leads from Google Ads. Strong key performance indicators (KPIs) include campaign-level cost per acquisition and conversion rate to verify that the work meets the goal while staying within budget.
You’ll then use those digital advertising KPIs to judge each move: running A/B tests on landing pages, refining ad groups, and updating creative.
This is how tracking the right metrics helps you inform your next move. You’ll spot trends, identify patterns and proactively spot problems before they become a bigger issue.
Why measuring the right metrics matters
But, with so many metrics out there, which ones should you track?
As Marissa Homère, the VP of Marketing at Irwin said in a LinkedIn post:
“The problem for marketers isn’t data scarcity—it’s intelligence deficit. I know of (and have previous experience with) companies that are tracking 47 different marketing metrics across six platforms. Their weekly reporting meetings take three hours. Their optimization decisions take weeks to implement. Their business impact from all this measurement? Nearly zero.”
Don’t worry about tracking everything. You just need to narrow down which digital marketing metrics apply to your goal and focus on those.
How to identify a vanity metric
Metrics become vanity metrics when they aren’t tied to business outcomes.
If your goal is to grow revenue while keeping ad spend down, track metrics like cost per conversion, cost-per-click and monthly recurring revenue to show the impact of your marketing while excluding metrics like page views.
If you’re unsure, ask yourself:
“Does this metric tie directly to your business goal?”
If not, it's probably vanity.
The same metric can be valuable or useless depending on context. For example, the number of impressions helps measure your brand awareness efforts, but is irrelevant for driving sales for an e-commerce business.
The top digital advertising metrics that matter
Don't worry about tracking everything. You just need to narrow down which ones are relevant to your goal and focus on those.
Not sure which metrics qualify as strong KPIs? Check out our complete guide to marketing KPI examples for more.
Start with this list of metrics by campaign goal to focus on the measures that best show impact for your business and marketing goals.
| Marketing campaign goal | Recommended metrics | Why these matter |
|---|---|---|
| Build brand awareness | Impressions, reach, frequency, click-through rate | Shows how many people see your ads, how often they see them, and whether they engage |
| Maximize revenue | Return on ad spend, return on investment, customer acquisition cost | Shows profit per ad dollar spent, overall campaign profitability, and cost to acquire customers |
| Drive conversions | Number of conversions, conversion rate, cost per conversion | Shows how many conversions you get, at what efficiency, and at what cost |
Campaign goal: Build brand awareness
Brand awareness measures how familiar people are with your brand. For example, many people think of Google for web search and ChatGPT for AI chat. Those brands have high awareness in their respective categories.
These campaigns may not generate direct revenue, but they support sales and lead generation by building trust and shaping perceptions of your brand.
Brand trust drives sales: 87% of customers will pay more for products from brands they trust, according to Salsify's 2025 Consumer Research report. Use these metrics to grow brand recognition in a new or existing market and reach new target audiences.
If you’re running ads to support a brand campaign, track a few metrics to show your brand team how those ads helped build your company’s brand.
Ad impressions & reach
Reach is the number of unique people who see your ad. Impressions are the total number of times your ad is shown.
If one person sees your ad five times, that’s one person reached and five impressions.
Why these metrics matter for brand awareness:
- Reach shows how many potential customers you're reaching with your brand. If you're launching in a new market or targeting a new audience segment, you need significant reach to make sure enough people see your ads.
- Impressions show how often people see your brand to remember it.
Ideally, you’ll want high reach with enough impressions to let your brand stick. This number varies by your campaign and audience, and industry, but start with a target of 3-7 ad exposures per users.
Too few impressions make your brand hard to remember; too many lead to ad fatigue and wasted ad spend.
Our guide explains reach vs impressions and shows when to use each to inform your campaign decisions.
Frequency
Frequency is the average number of times a unique user sees your ad and is calculated by dividing impressions/reach Impressions ÷ Reach.
People usually need to see a brand several times before it sticks. While the ideal frequency varies by brand, industry, and campaign objective, start with a baseline of 3-7 exposures and adjust based on your results. At that level, you build awareness without letting the ads go stale.
Monitoring other metrics alongside frequency can tell you whether you’re at the right level for your audience. Watch for positive signals like:
- If average engagement remains steady or rises as posting frequency increases, it means people are interacting with your posts instead of scrolling past.
- Consistent click-through rates indicate your ads remain relevant
- Strong engagement rates shows your ad is connecting across repeated views.
If engagement stalls or drops as you raise frequency, it's time to refresh your creative approach. Digital marketing agency Inflow emphasizes the importance of proactive creative rotation to avoid ad or brand fatigue:
“Your creative can be as engaging as possible — but, if your audiences are exposed to it over and over again, brand fatigue will eventually set in. How quickly this happens will vary, depending on the number of ads you're running and the audience size you're targeting. However, to keep your ad campaigns as fresh as possible, we recommend adding new creative on a quarterly basis (at minimum) for best results.”
The key is to refresh your ads before fatigue sets in, not after engagement has already declined.
Click-through rate (CTR)
Knowing how many people see your ads is important, but you also want to know if people are engaging with them. Click-through rate (CTR) shows the percentage of viewers who actually click your ad.
Calculate it with this formula:
(Clicks ÷ Impressions) × 100
Hence, if your ad receives 10,000 impressions and 250 clicks, your CTR is 2.5%.
In brand awareness campaigns, CTR is an early indicator of ad effectiveness. A high CTR indicates your ad is generating interest and driving clicks to your link, resulting in more website traffic for your business.
While engagement isn’t the primary goal of a brand awareness campaign, it still indicates that people find your ad interesting enough to interact with. A stable CTR confirms your ad copy, headline or creative is effective and signals you’re targeting the right demographics or keywords.
What’s a good click-through rate to aim for?
A good CTR varies by industry, ad format, ad position and channel.
Data from CXL puts the average CTR at 6.64% for search ads and 0.57% for display ads. Display advertising typically gets lower CTRs because it interrupts browsing, while search ads reach people actively searching for solutions.
Use these CTR benchmarks as starting points, but focus more on your campaign data trends over time and aim for steady improvement. A steady CTR indicates your creative is performing as intended.
Campaign goal: Maximize revenue
If you track only one metric, choose revenue. It shows marketing's value in a way leaders understand: dollars in versus dollars out.
Driving revenue is a key marketing role, as Kiaran Geen writes for Campaign Asia.
Marketing’s role isn’t just to support sales and revenue; it’s to drive it. Full stop. There’s no such thing as sales revenue or marketing pipeline; it’s all just revenue growth. And when you frame marketing’s role this way, it becomes a lot easier for the rest of the business to understand, value, and invest in.
Start with these three metrics to track your revenue impact.
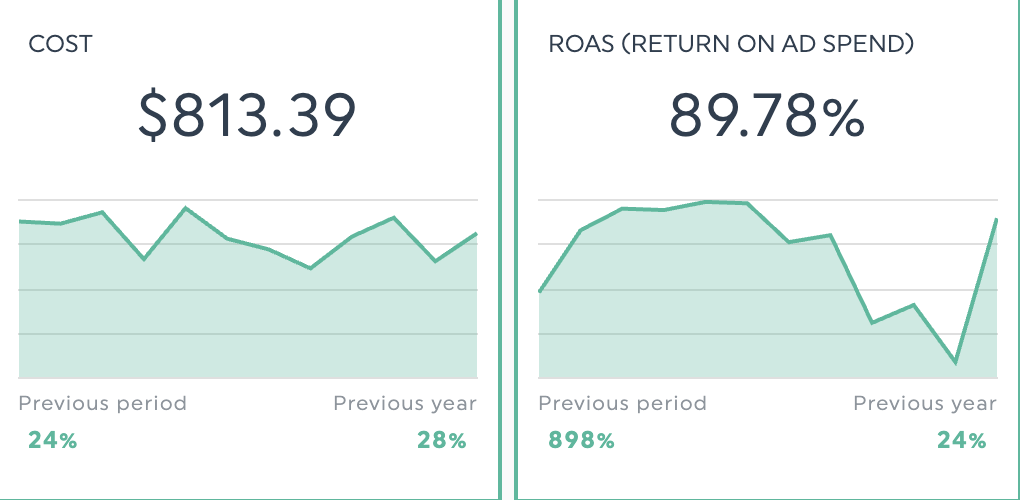
Return on ad spend (ROAS)
ROAS is the revenue earned per dollar spent on ads. If you spend $3,000 on TikTok ads and attribute $15,000 in revenue to them, your ROAS is 5:1, or 500% when expressed as a percentage.
Use this formula to calculate your ROAS:
Total revenue from marketing ÷ total advertising spend
Use this metric to guide budget choices across digital ad channels, or to flag campaigns for improvement when ROAS falls short. Google Ads offers Smart Bidding options, such as Target ROAS, which adjusts bids based on predicted conversion value to help you reach your ROAS goal.
Tip: Factor in customer lifetime value when evaluating channel efficiency. A customer gained for $200 might generate more than $2,000 in lifetime value.
If you (or DashThis’s AI insights) see ROAS trending down while spend rises, it likely signals fatigue and an opportunity to adjust targeting, refresh creative, or test new audience segments.
However, only focusing on ROAS can be misleading. Look at the campaign’s total cost and the full budget to get the right picture.
Which leads us to the next metric.
Return on investment (ROI)
ROI is a cost-efficiency metric that shows whether your entire campaign is profitable when you factor in creative, labor, and technology costs—not just ad spend.
Unlike ROAS, which only measures ad performance, ROI accounts for production costs, agency fees, tool subscriptions, and other costs associated with running your campaign. This makes it critical to evaluate complex campaigns where total costs extend well beyond your ad budget.
Say you run a campaign with a strong 5:1 ROAS, but if you spent $10,000 on video production, $5,000 on influencer partnerships, and $3,000 on software tools, your actual profit could be much lower than ROAS implies. Track ROI so you always know your real return on marketing spend.
Customer acquisition cost (CAC)
Customer acquisition cost is the amount you spend to win one new customer. Calculate it by dividing total marketing and sales spend by the number of new customers:
Formula: Total marketing & sales costs ÷ Number of new customers acquired = CAC
CAC shows whether your customer acquisition strategy is financially sustainable. Context matters. A $200 CAC might be great if those customers generate $2,000 in lifetime value, but it would be unsustainable if they only generate $75. Use CAC data to guide budget allocation across channels, or measure how much it costs to improve underperforming ad channels.
Tip: In addition to CAC, consider cost per lead (CPL) if your goal is to drive lead generation.
Campaign goal: Generate conversions
Conversions sit right alongside revenue as the metrics that prove your marketing actually works. Sign-ups, trial starts, downloads, purchases—these aren't vanity metrics. They're proof that you're not just reaching people, but reaching the right people and convincing them to act.
Marissa Ryan, CMO at the marketing agency VisualFizz, says:
Unless there is a specific strategy behind branding and awareness, the only metrics that really matter are conversion metrics. Clients are paying money with the hopes of getting higher returns so emphasizing how strong click-through rate is or how many impressions something got is meaningless if the goal is ROI.
This is why conversion metrics deserve your close attention as they directly connect your marketing spend to business results.
Key metrics for tracking conversion performance include:
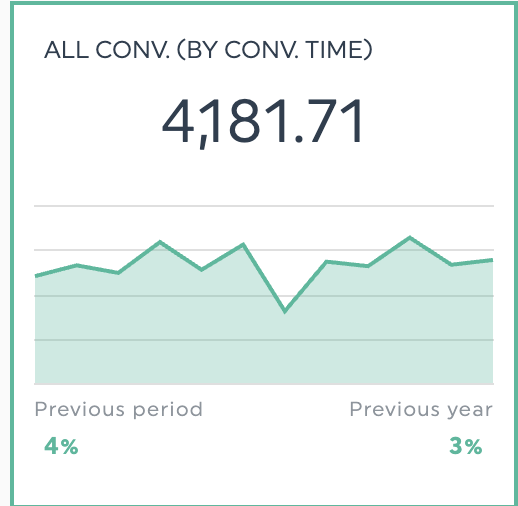
Number of conversions and conversion rate
The number of conversions is the count of completed goals, such as form submissions, purchases, or free trial sign-ups. Conversion rate is the percentage of clicks that result in the desired action.
Together, these metrics show both how many conversions you get and how well you convert visitors. The count reflects your campaign's impact, and the rate shows how efficiently you convert visits into signups or sales.
Review these metrics together to determine what's happening. Here’s what to look for.
- High conversion rate but low volume? Your campaign is converting well. Now it's time to build on what's working. Broaden your audience segments or increase your budget to reach more of these high-quality prospects.
- High volume but weak conversion rate? You're paying for a lot of low-intent traffic. Either tighten your targeting to attract more qualified visitors, or review your landing page to improve conversion rate.
- Both climbing? This is your green light. Gradually increase spend, but keep monitoring to ensure efficiency doesn't decline as you scale.
- Both dropping? Hit pause and investigate for signs of ad fatigue, competitor activity, seasonal shifts, or platform algorithm changes. Figure out what's happening before you continue.
Cost per conversion
We’ve covered volume and efficiency metrics, but what about evaluating costs and budget? That’s where cost per conversion comes in.
Cost per conversion is the amount you pay for each conversion. Calculate it by dividing total ad spend by the number of conversions. For example, $5,000 spent on LinkedIn ads that yield 100 qualified leads results in a $50 cost per conversion.
This metric reveals whether your campaigns are financially sustainable and whether you’re actually earning revenue on every new customer you bring in.
Measure cost per conversion to compare channel cost-effectiveness. It helps you set realistic budgets and spot scaling issues early, such as when results don’t improve as spend increases. That pattern suggests you’re reaching less qualified audiences and should refine your targeting.
How to track and visualize digital ad metrics in DashThis
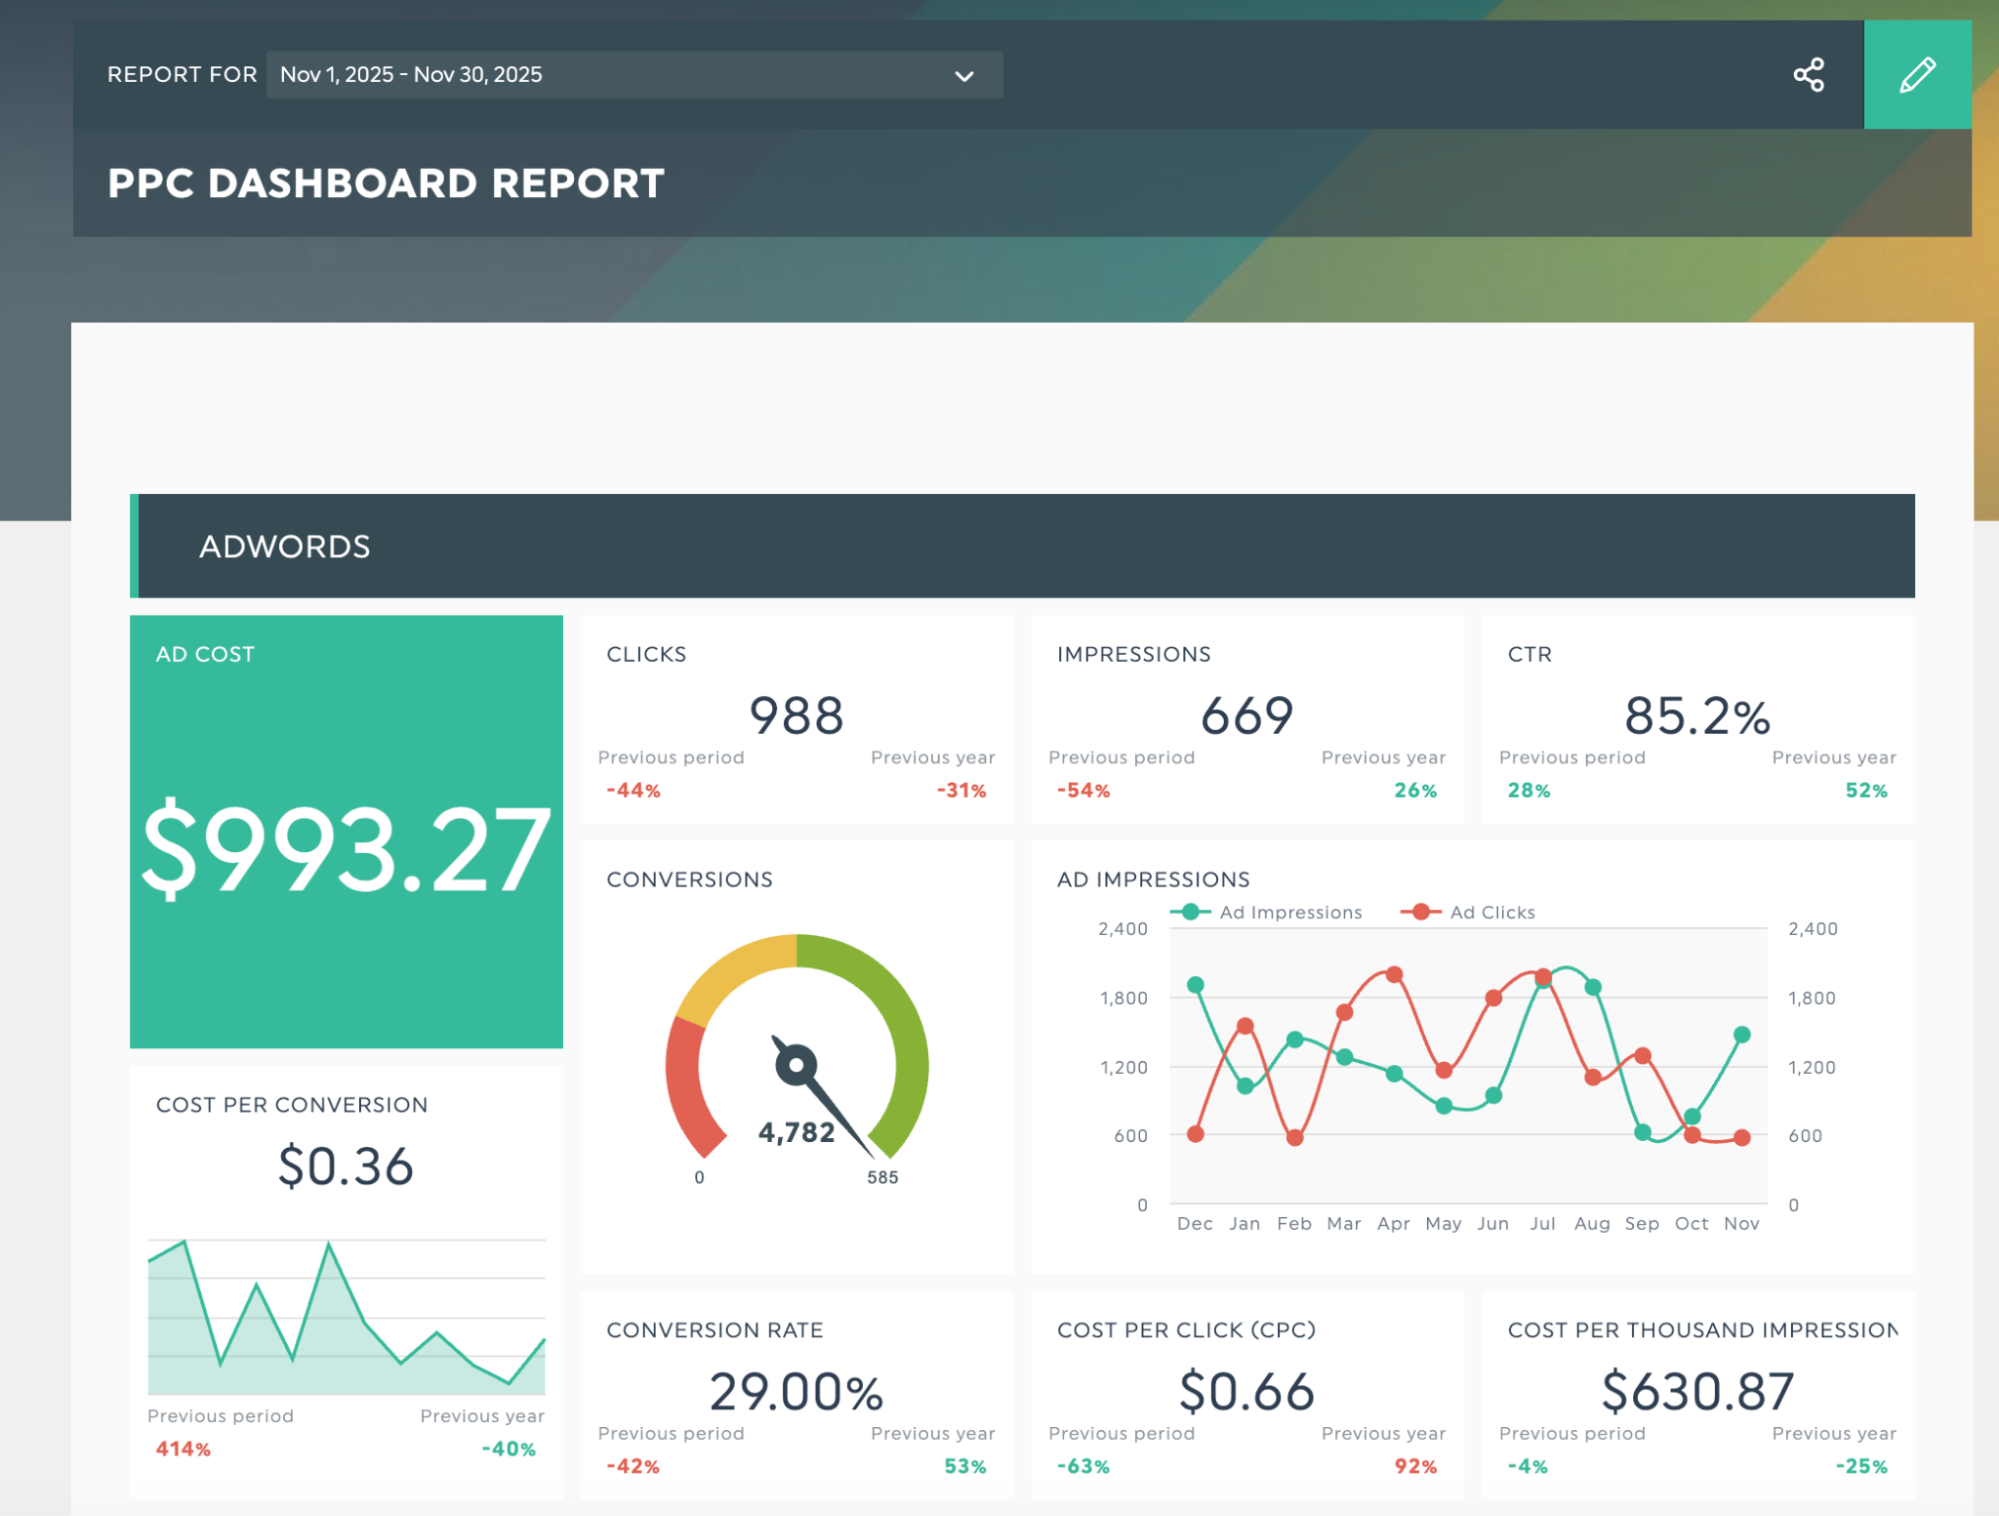
Get this PPC dashboard with your own data!
Sign up for a DashThis 14-day free trial and follow this guide to see how DashThis can save time when creating reports.
Step 1: Connect your ad accounts
For a simple way to get all your digital advertising data into your DashThis dashboard for easy comparison, we’ve got you covered!
Firstly, DashThis’s 34+ integrations let you view your KPIs in one place across major digital advertising platforms. Need data from a CRM or proprietary software? No problem. Upload it as a CSV file to add your own data.
Step 2: Structure your dashboard
Once your data is imported, it's time to organize it into a dashboard. DashThis offers over 50 report templates covering the most common reporting scenarios: digital advertising, social media, multi-channel campaigns, and more.
Instead of spending an hour formatting cells in Excel or Google Sheets, you can pull together a complete report in minutes using these templates.
Now that your dashboard is set up, you can add visuals and widgets to customize it to your client’s reporting needs.
To make your digital advertising data easy to understand, use these visuals:
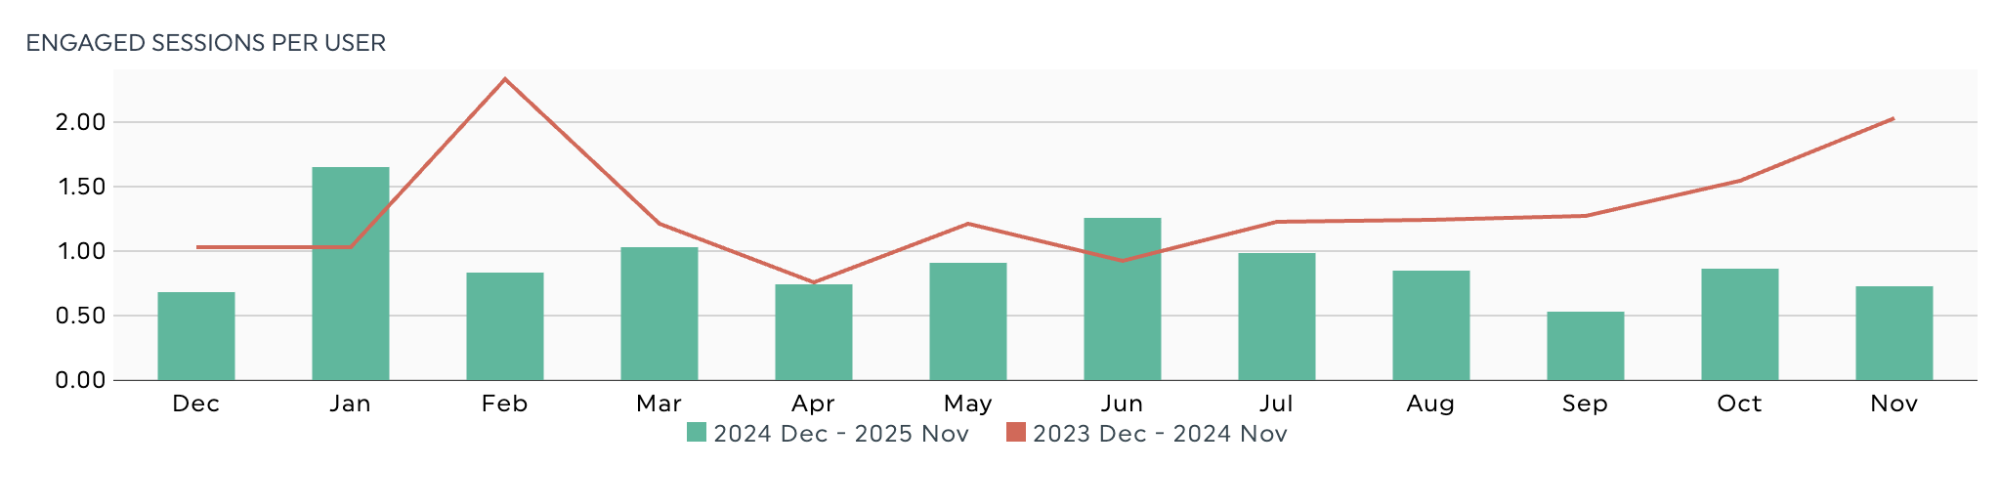
Trend charts can use bar and line charts to compare multiple metrics over time, like impressions and click-through rate, when reporting on a brand awareness campaign.
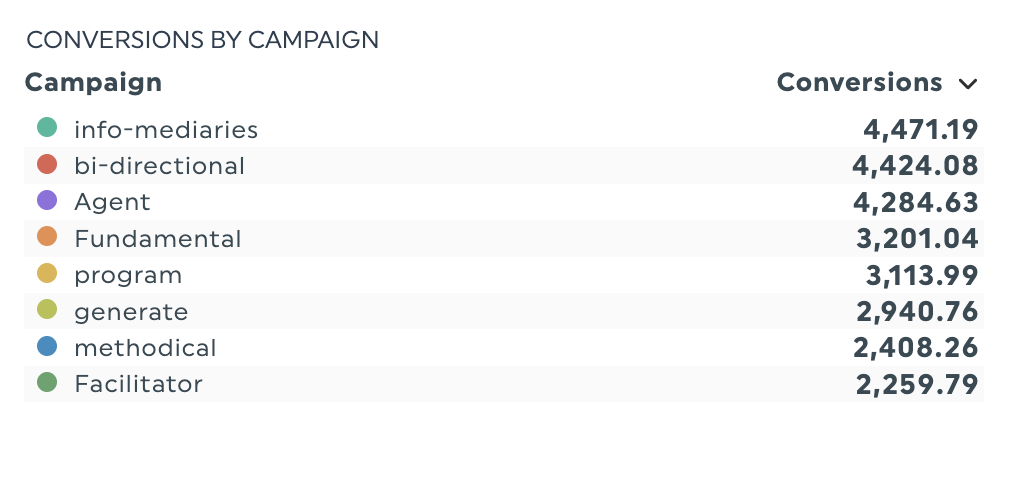
Comparison tables help you compare data across categories such as device type, campaign, or marketing channel.
Use these tables to quickly compare metrics across advertising platforms and identify campaigns that drive the most conversions and attributed revenue, along with areas to improve.
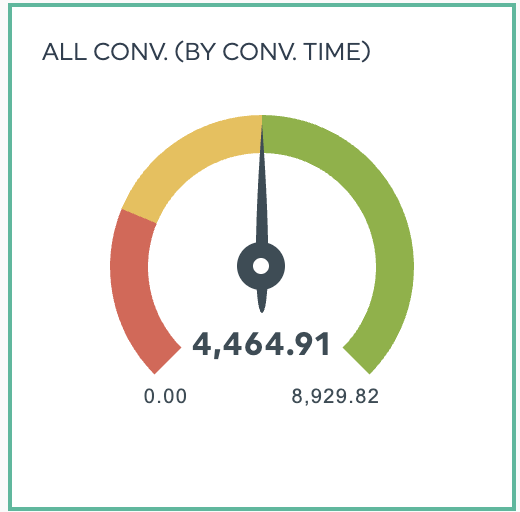
Gauge widgets show progress toward specific goals. They work well in executive dashboards, providing an at-a-glance view of vital KPIs.
If you’re building a dashboard to demonstrate the ROI and profitability of your paid acquisition campaigns, use this metric to show your ROAS relative to your target.
Need a more in-depth explanation? See our guide on effective data visualization techniques.
Now that you've built a clear, audience-focused dashboard, you're ready to review your data and translate your findings into practical next steps.
Step 3: Add context to turn metrics into insights
You've built a dashboard full of metrics. What do those numbers mean, and what should you do with them? Good analysis turns the data you track into clear guidance for better digital ad performance.
DashThis offers two tools to help you analyze data and display it in your dashboard.
Add context to your data with comments and annotations.
Context is what makes your data meaningful.
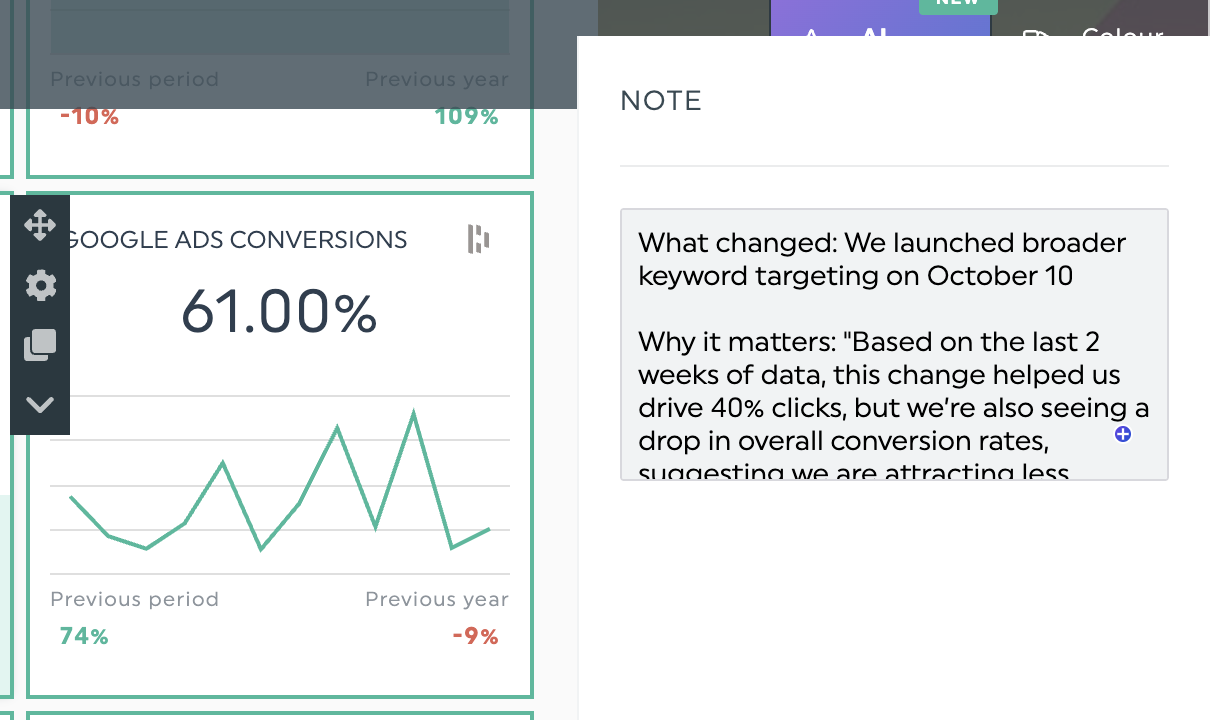
For example, if you’re explaining a drop in conversion rate in recent Google Ads results, you’ll need to explain what changed, why it matters, and what you’ll do next. Here's how you might frame it:
- What changed: We launched broader keyword targeting on October 10
- Why it matters: Over the past two weeks, the change led to a 40% increase in clicks, but conversion rates fell, indicating an increase in visitors who are less likely to buy.
- Next steps: pause broad match keywords and shift 60% of the budget to proven search terms. Aim for a 3.8% conversion rate within three weeks.
Use DashThis's comment and annotation tools to add the analysis neatly to your dashboard.
Automated AI insights to act as a second analyst
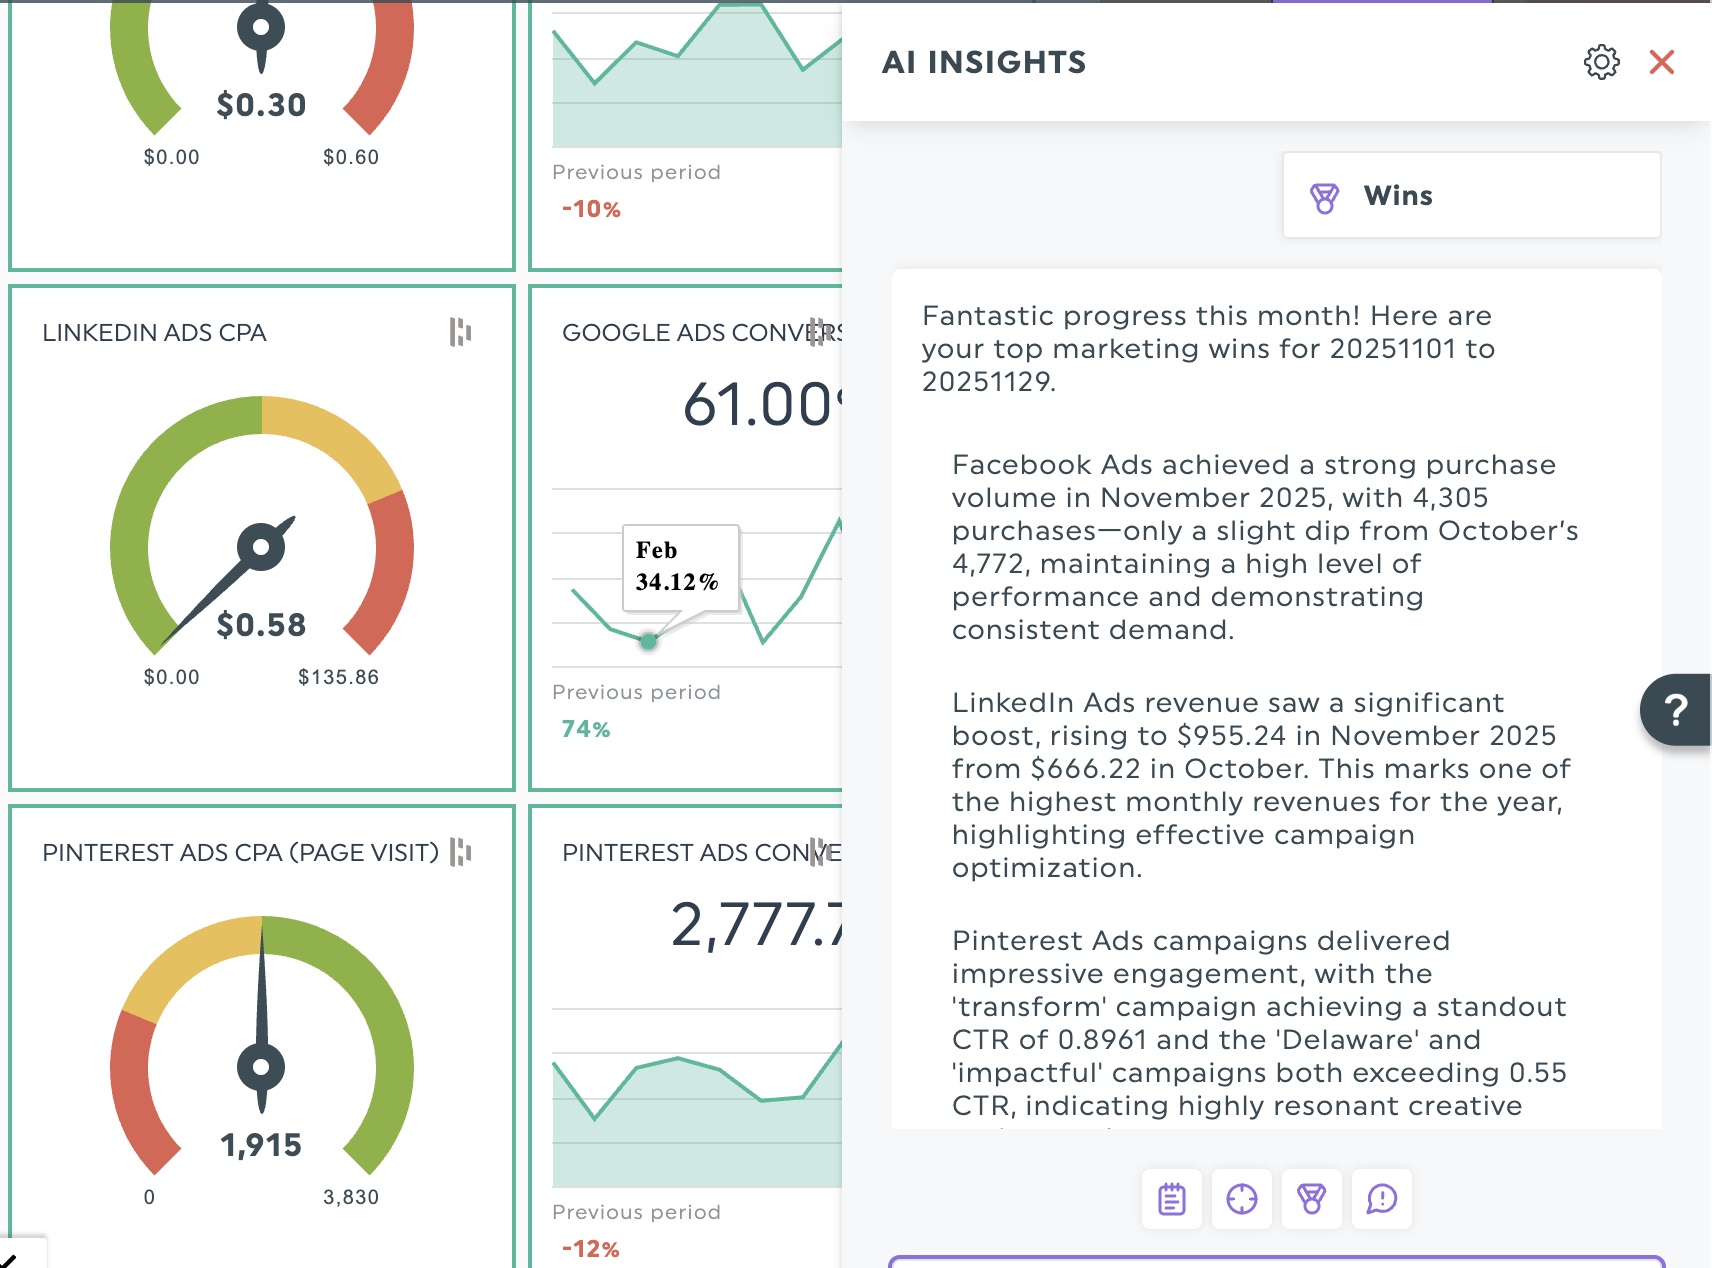
DashThis's AI Insights acts as an on-demand second analyst, scanning your data and highlighting important changes and unusual patterns you might miss.
With DashThis’s AI reporting tool, you can view your dashboard data in four ways.
- Summary insights: See all your digital advertising metrics in one place on your dashboard. It shows how your numbers changed since the last reporting period and offers quick pointers to help you begin your own review.
- Opportunities: Identify areas to boost performance with a clear next step. Helpful for flagging ways to improve speed or cut costs.
- Wins: Show your top performers with clear numbers that show what's working. Use them in client summaries to build trust and demonstrate actual results.
- Issues: Identify underperforming metrics and campaigns early. Show the client you’ve found a problem and explain how you’ll steer the campaign back on track.
Step 6: Share your report!
Once you’ve done your analysis, it’s time to share your report with your team to keep everyone on the same page.
Skip manual reporting and let automation handle it. DashThis updates reports instantly, so everyone is informed. Use report scheduling to set up weekly or biweekly dashboard dispatches to help teams spot trends early and adjust before minor issues become major problems.
Choose DashThis to help you measure and report on the right digital advertising metrics
Remember, you don't need to track every metric. Use this guide to help you make sure you’re focusing on the right digital advertising metrics in your reports.
DashThis turns your raw ad metrics into clear recommendations you can share with clients. Our automated reporting software helps you free up your time from manual reporting, so you can focus on keeping campaigns on track and delivering stellar results for your clients.
Ready to say goodbye to information overload every month? Try DashThis to automate your digital advertising reports and make every metric count. Start your free trial today.

Measure your digital advertising metrics in Dashthis now!
Read More

Don’t miss out!
Follow us on social media to stay tuned!
Automate your reports!
Bring all your marketing data into one automated report.
Try dashthis for free