DashThis Filters: Your Handy Guide

The main purpose of reporting is to provide meaningful data and insights. It’s our job as reporters to build a strong data story.
But when data is pulled in from multiple data sources, an excess of metrics can misrepresent your hard work.
DashThis filters allow you to build a clear story. Filters can come off as overwhelming, but with DashThis, filters are friends. They’re easy to use and help you show off your impressive results.
Here are some insights into why you need filters, steps to using filters, and tips for using filters within DashThis.
What is a filter and why would I use one?

A filter brings data together in digestible pieces. By trimming down the data, more specific insights can be shown.
For instance, let’s say you’re writing a blog focused on Louisiana roof repair companies. Seeing the entire country’s interaction with the blog might be fascinating, but ultimately you want to know if Louisianans have read your article.
Adding a filter to display metrics such as time on page and page views for only people in Louisiana allows you to focus on the meaningful results.
While writing your data story, it’s important to remember that not all data belongs together and not all data needs to be reported on.
Steps To Using A DashThis Filter
Build a Report Outline
The initial determination you need to make is the purpose of the report. Typically, the goal of your report is the same as the goal of your work.
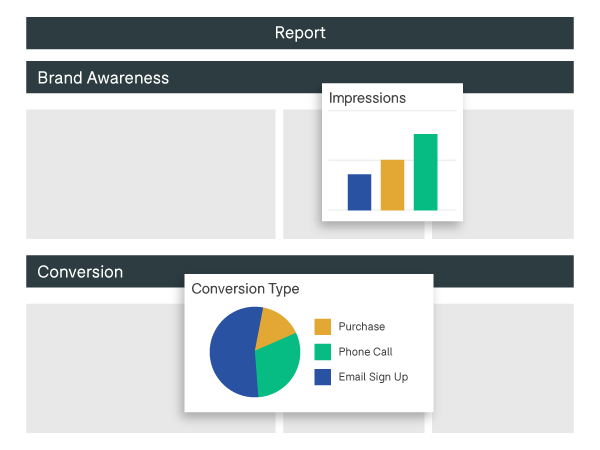
As you build an outline of your report, think about how the report needs to be split. You can split reports by platform (Facebook, Google, Etc.) or ad goal (impressions, conversions, etc.).
Once you have the sections decided, think about the key performance indicators (KPIs) for that section. For instance, widgets for a brand awareness section should focus on impressions or reach, not conversions. By thinking the report through from the top, every data point you put on the report will work together to tell your data story.
Determine the Goal of the Data Point
Once the outline of the report is made, data points need to be determined.
For brand awareness on Facebook, think about what tells your story. A company that requires a single person sign-up would be most interested in reach. However, a company that is focused on having their brand shown frequently will care about impressions.
Once the metric is determined, think about how the data point is best displayed.
DashThis offers tons of options for displaying your data including bar graphs, pie charts, and lists.
If you want to show a seasonal change in a metric, use a year-over-year bar graph. A preset widget works best if you want to simply display the metric. List widgets allow you to compare a metric by a dimension such as time on site by landing page.
Add a DashThis Filter
Now that you have spent time thinking through the data story and adding the widget, it’s filter time!
DashThis has lots of built-in filter options. To determine the necessary filter, think about what needs to be trimmed off your data.
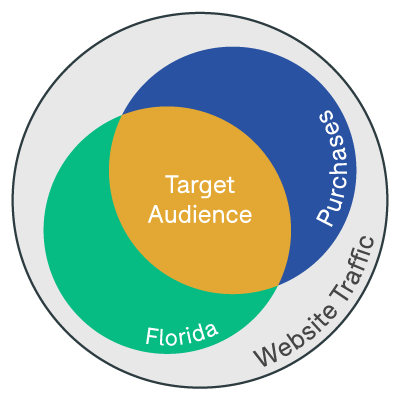
Adding filters such as locations, campaigns, demographics, or ad networks will narrow down your data. Just go ahead and try it out. You can always delete the widget and try again.
For example, let’s say you add a conversion rate widget to your report. You might want to remove brand awareness ads to get a clearer picture of how the conversion ads are performing. If you want to gain conversions in a particular region, add a filter that only shows the conversion rate for that region.
Review the results
Once everything is built, take a step back and see if the widget meets the goals from step 1 and 2. Ask yourself a few questions:
Does the widget meet the goal of the report? Will the person who reviews the report know the purpose of the data point? Is the data point specific enough to tell an accurate story?
If you answered no to any of these, rethink your filter. It might take some time to get exactly what you want from the data, but a clean report is worth it.
Tips and Resources for DashThis Widgets
DashThis has different ways to filter for each platform (Facebook, Google, etc.). Getting familiar with the options DashThis provides for your platforms will help you set up data set in the native platform.
Paid Facebook and Instagram
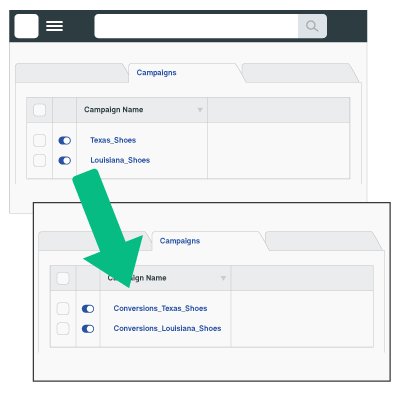
Paid Facebook and Instagram filters on DashThis focus specifically on how the campaigns, ad sets, and ads are named. As you name these within Business Manager, think about how you will want to group them later.
If you have multiple ad sets all with the goal of conversions that you will want to combine later, think about including “conversion” in the ad set name.
Google Ads
AdWords (now Google Ads) widget filters have more options than Facebook and Instagram. Some of these include Campaign Name, Ad Network, and Keywords.
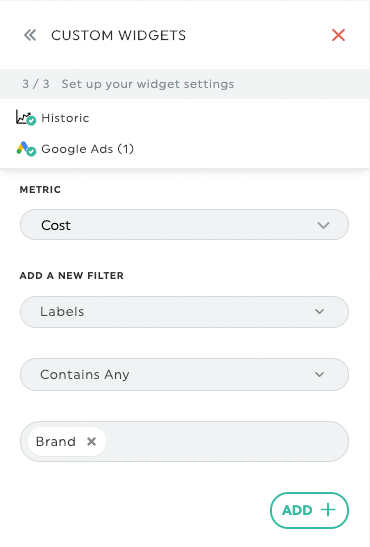
All of these are super helpful, but a hidden secret is using labels as a filter. Labels are a simple way to group campaigns, ad groups, and even ads together.
For example, a property management client has multiple budgets within their Google Ads account. They have a monthly budget for their overall brand and a budget that goes to apartments with lease specials. Add a “Brand” label to all the campaigns on the monthly budget and a “lease specials” label to all the other campaigns. Now that you have given each campaign a label for their specific budget, you can use a filter based on labels to easily sort out the data on the report.
Google Analytics
Looking at Google Analytics filters for widgets can easily scare people off. A blank textbox is intimidating, but DashThis offers tools to help.
Before you begin, I highly recommend reading the DashThis guide to Google Analytics filters.
You can also eliminate spammy traffic directly from GA with the tips in this article.
The most important part of this guide is the Google Analytics Filter tool. This tool builds the filters for you, so all you have to do is copy and paste them (make sure you copy it and save it to your own account before using). If you don’t know the Dimension Name or Metric Name that you need, look within the actual Google Analytics platform.

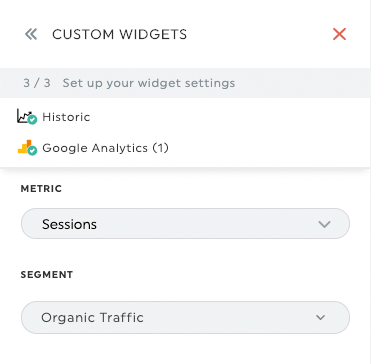
Still Overwhelmed? Google Analytics widgets can be filtered using Google Analytics Segments. Just build a Google Analytics segment and then select it within the widget settings. Just note that it might take a bit of time for the segment to be available within DashThis.
If you work hard to get great results, why would you settle for anything less than a great presentation? Take the time to think through your data story. Find the most meaningful information. And bring those metrics to light with DashThis filters.
Want to create your own easy-to-read DashThis report with useful filters?
Ready to automate your reporting?
Read More

Don’t miss out!
Automate your reports!
Bring all your marketing data into one automated report.
Try dashthis for free
