The Beginner’s Guide to Advertising Performance

Your boss recently assigned you a bunch of new ad campaigns.
And you’re not 100% sure where to begin.
What metrics should you highlight for an eCommerce store sales ad vs. a B2B SaaS startup’s lead generation campaign? What tools should you use among dozens? How do you ensure clients find value in your reports?
This guide gives you the lowdown:
- What is Advertising Performance in Marketing?
- Why Track Your Advertising Performance?
- How to Measure Advertising Performance in Marketing
- How to Automate and Combine Your Advertising Performance with DashThis
- 5 Best Practices for Advertising Reporting
- Automate Your Advertising Performance with DashThis
What is Advertising Performance in Marketing?
Advertising performance refers to your ad campaigns’ measurable results, determined by engagement, sales, and profitability metrics. Common objectives include improving brand awareness, generating leads, and driving sales.
Quick distinction: Don’t confuse this with performance advertising (or performance marketing), which refers to campaigns where you pay only for specific actions, like clicks and conversions.
Why Track Your Advertising Performance?
34.2% of marketers rarely or never measure the return on investment (ROI) of their marketing spend — no surprise if a big chunk is wasted.
Here’s why you should take attribution seriously.
Optimize budget allocation
If you don’t measure your advertising campaigns, especially with hundreds of ads running concurrently, you won’t know which campaigns and channels are working.
Ergo, you’re more likely to waste money on inefficient ads and miss untapped opportunities.
Improve campaign effectiveness
High ad click-through rates (CTRs) but low landing page conversions indicate a poor website experience. Whereas zero ad impressions usually mean you’re targeting the wrong keywords or bidding too low.
By tracking your advertising performance metrics regularly, you identify gaps in your marketing funnel and spot trends early. It’s the best way to assess the value of your marketing efforts.
Make data-driven decisions
Your advertising KPIs determine the next move.
Suppose you’re experimenting with omnichannel but don’t know if it outperforms your previous single-channel marketing campaigns. Compare the PPC KPIs in both campaigns (like close rates and customer acquisition costs)! It’ll determine if you should scale your omnichannel marketing strategy.
Now that we’ve explained what Google wants to see, let’s get into what you’re really looking for. 😛
How to Measure Advertising Performance in Marketing
The following metrics and advertising tools start you off the right foot, whether your goal is engaging with your audience, improving industry authority rankings, or growing your revenue.
Digital advertising
BEST FOR: Omnichannel marketing campaigns targeting multiple touchpoints
Run digital ads almost anywhere online, from apps and websites to search engine result pages (SERPs) and email inboxes.
If you’re going all-in on your digital marketing campaigns — say, you’re integrating pay-per-click (PPC) ads with an SEO content marketing strategy — you can’t go wrong with these metrics. Track them regularly to optimize your marketing budget.
KEY METRICS:
- Impressions
- CTR
- Conversion rate (CVR)
- Cost per click (CPC)
- Return on ad spend (ROAS) *more common in eCommerce
TOOLS:
- Google Analytics
- Google Ads
Social media advertising
BEST FOR: Community building and audience engagement (e.g., B2B companies building brand authority in front of a specific audience on LinkedIn)
Did the Q1 YouTube video ads engage viewers? How much did user-generated content (UGC) on Instagram grow followers? Did the thought leadership articles and industry insights on LinkedIn increase media mentions and coverage?
These metrics from your favorite social media platforms provide all the answers.
KEY METRICS:
- Shares
- Likes
- Comments
- Engagement rate
- Follower growth
TOOLS:
- Individual social media analytics tools (e.g., Meta Ads Manager)
- Social media management tools (e.g., Hootsuite, Sprout Social)
Search engine advertising
BEST FOR: Generating high-intent prospective customers (e.g., SaaS industry where its target audience are actively searching for solutions)
Search ads should drive sales, not just attract clicks. The first three metrics below are useful for both campaign planning and execution; the remaining for communicating impact to leadership.
KEY METRICS:
- CTR
- Quality score
- Conversion rate
- CPC
- Cost per acquisition (CPA)
- Cost per lead (CPL)
- ROAS
TOOLS:
- Google Ads
- Bing Ads
- SEMrush (PPC Advertising Toolkit)
How to Automate and Combine Your Advertising Performance with DashThis
Chaos ensues when there are hundreds of ads running simultaneously.
It gets more overwhelming when these ads are scattered across different channels.
To quickly analyze your ad performance and gain back hours of your time, consider using DashThis.
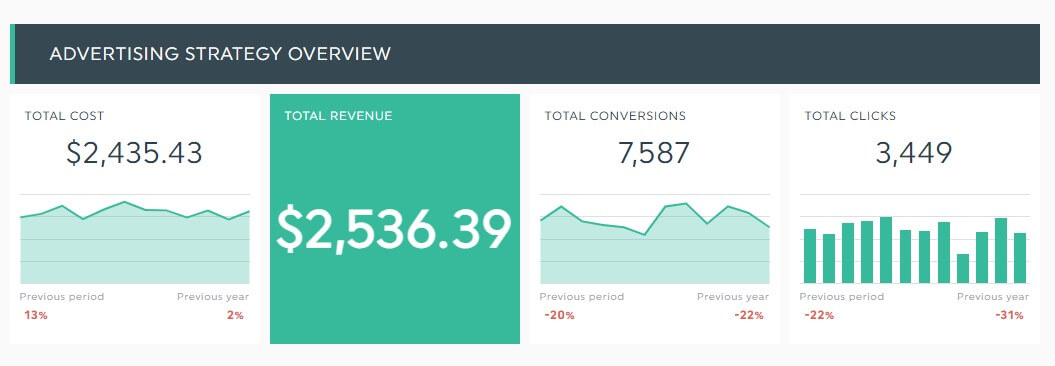
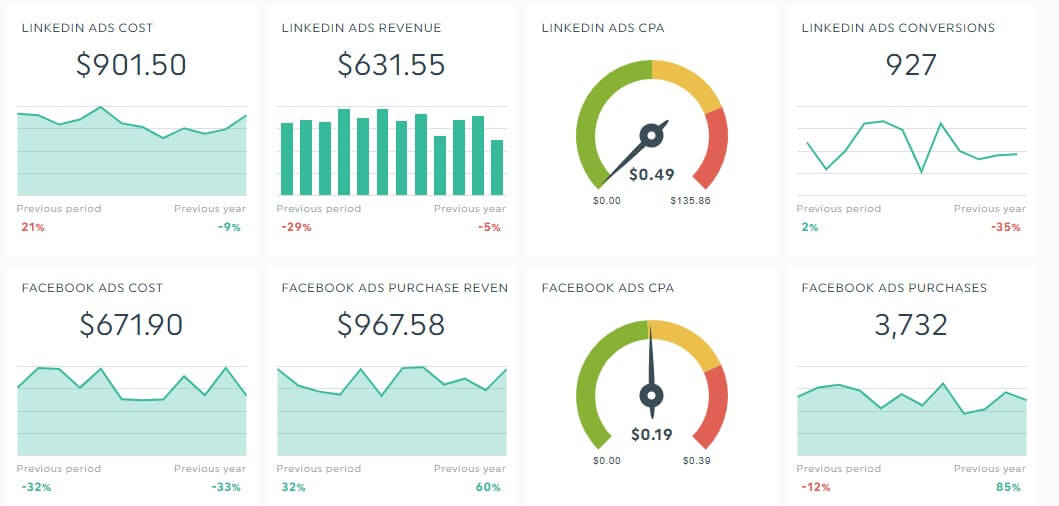
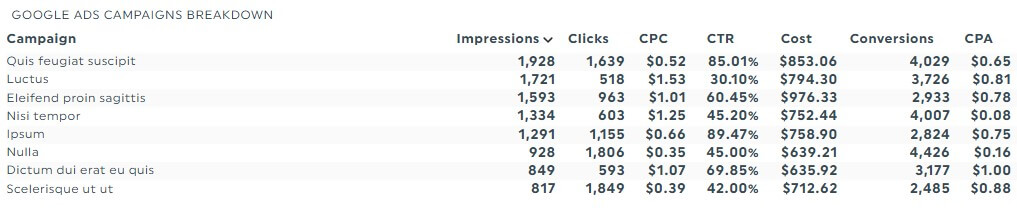
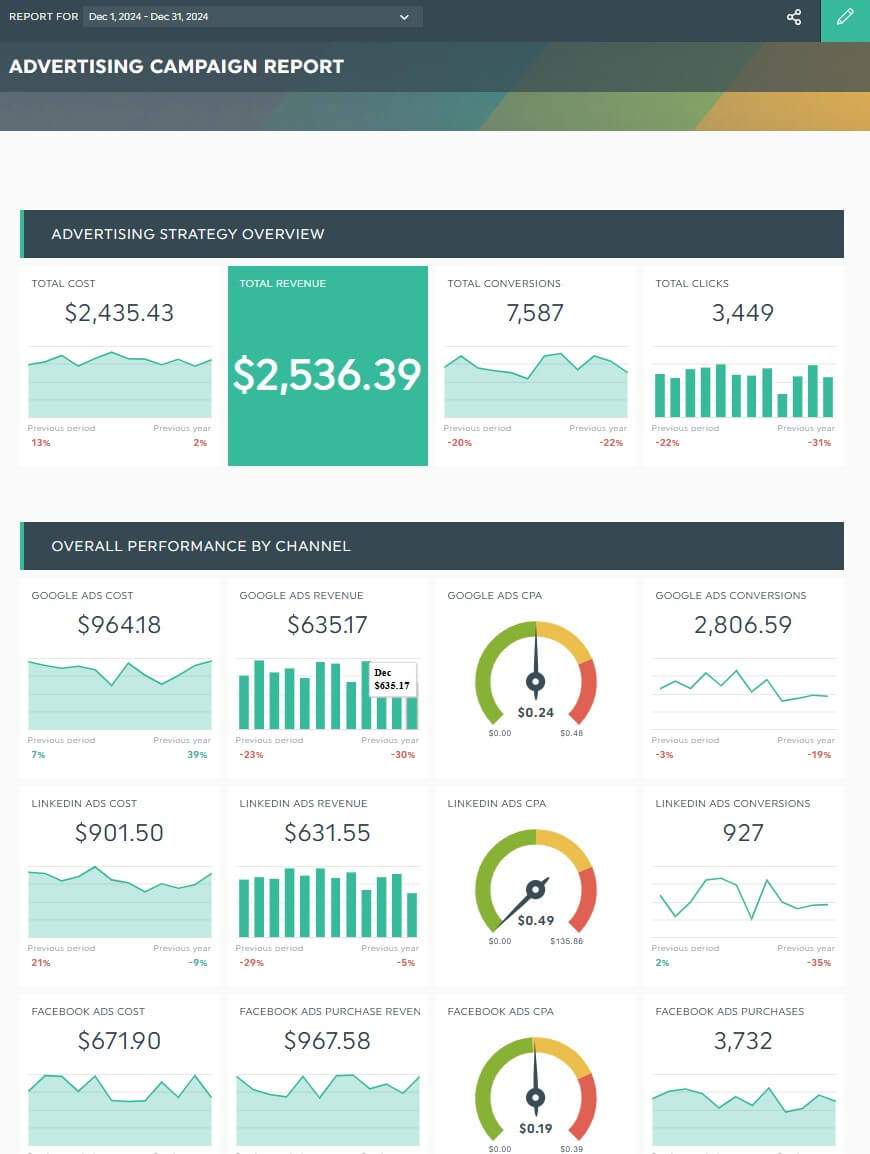
It’s the easiest marketing reporting tool that automatically gathers your entire data across multiple ad channels into one report. Note this all-in-one advertising report — it combines data from Google Ads, LinkedIn Ads, and Facebook Ads on a single dashboard.
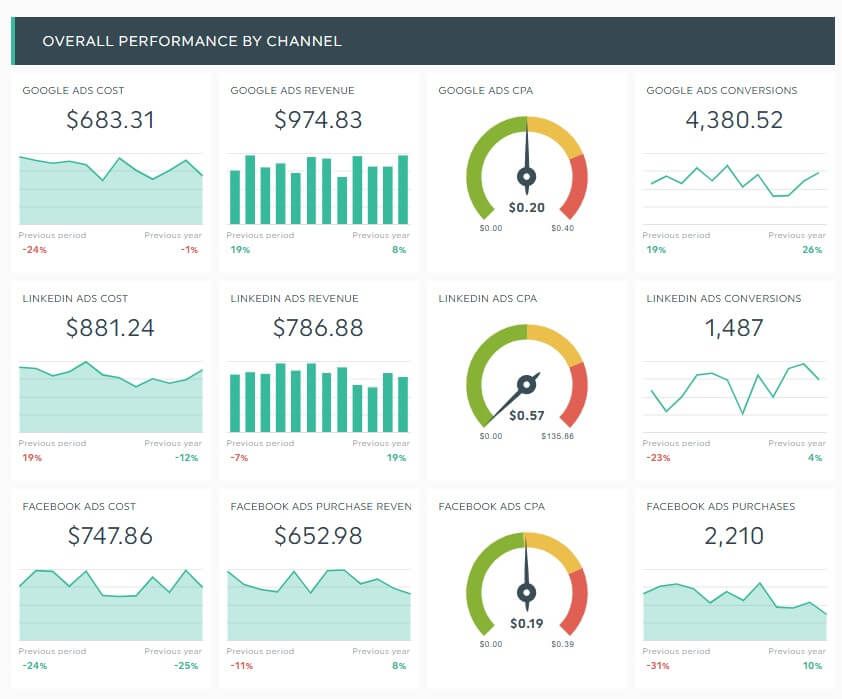
Right away, you can tell Google Ads generated better returns. Moving forward, you might allocate a bigger budget to this channel.
Start your free 15-day trial today to unlock:
- Automated all-in-one dashboard to view overall ads performance at a single glance
- Native integrations with 30+ channels, including popular advertising platforms like Pinterest Ads, Google Ads, and Meta Ads
- Unlimited capabilities for accounts, data sources, and users in all plans
- Custom dashboards for integrations and KPIs you want to reuse in the future
...and more.
Enough about the features.
Complete these steps to automate your advertising reports on DashThis:
- Select a free advertising report template
- Connect your advertising analytics tools (Note: DashThis connects with 30+ marketing channels)
- Choose your metrics in Preset Widgets (Tip: Use the metrics here or the metrics we shared in the previous section as a starting point if you don't know where to begin)
Sit back while DashThis automatically gathers your chosen metrics. Drag and drop them to form a cohesive look, like this:
Grab this free all-in-one advertising report template with your own data!
Customize the report. For example, choose your preferred color theme or upload the client’s logo for a professional touch.
You can also share comments directly in the report. Let’s say you want to recommend the next steps for an upcoming PPC campaign. Click Static Widget > Comment.
Include your recommendations.
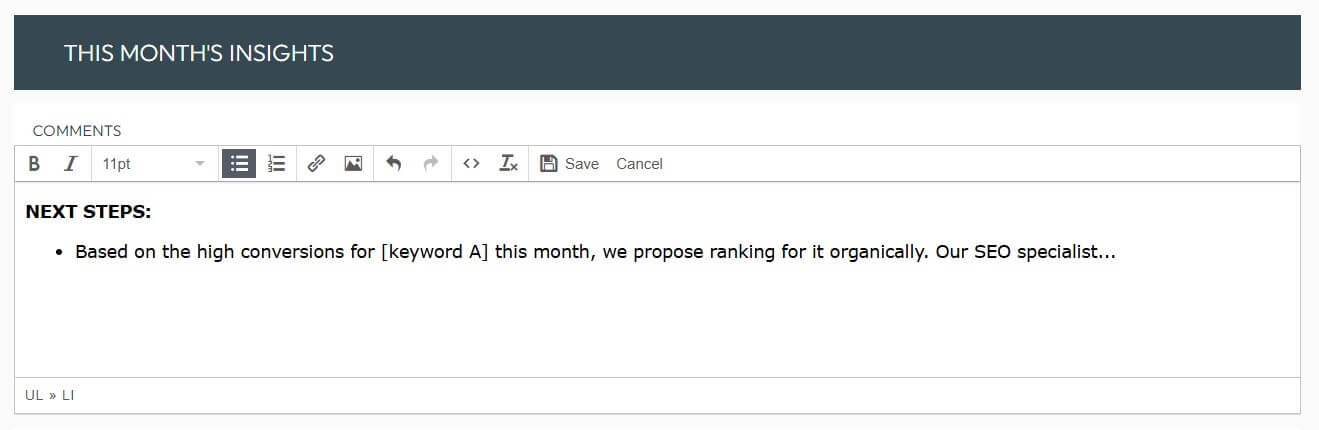
Click Save.
This Comments widget is also valuable when you want to:
- Educate clients with little marketing expertise (e.g., explain touchpoints vs. channels to a CEO)
- Share detailed results (e.g., “[Theme A] attracted specific audiences in the latest brand marketing campaign. Let’s double down on it. Here are some ideas…”]
- Make the case for a new strategy (e.g., “UGC drove 45% higher conversions than our influencer marketing and affiliate marketing campaigns combined last quarter. We propose…”)
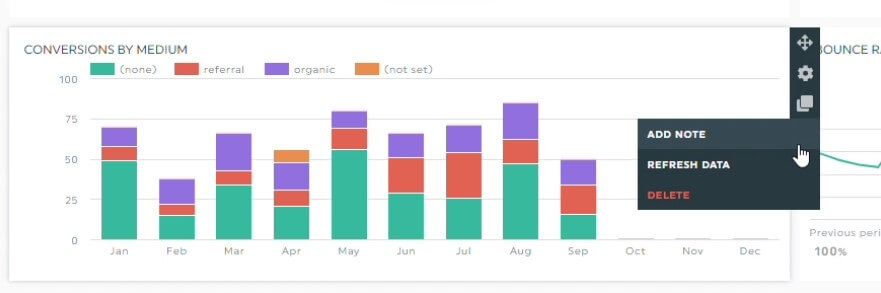
Alternatively, if you want to provide context for a specific metric (e.g., explain an erratic graph or chart), use the Notes widget. Hover to a metric and click Add Note. Include your findings and click Save.
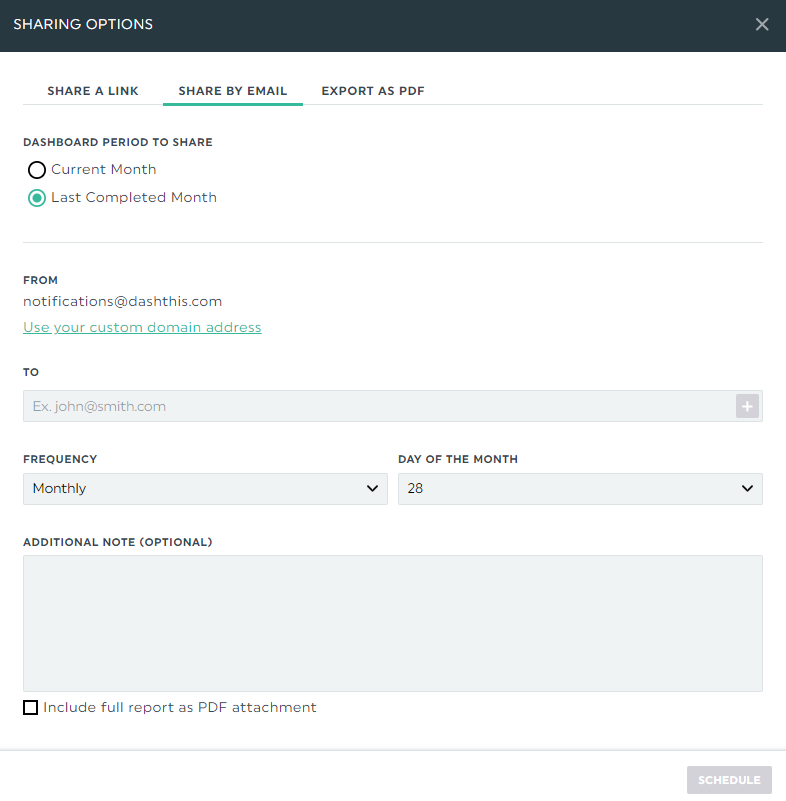
Once you’ve completed designing the report, schedule an automatic email dispatch to the client and marketing team:
- Hover over the Sharing Options icon
- Click Share by Email
- Set the dashboard period and frequency
- Add an optional note
- Click Schedule
Automatically send your report on your preferred schedule.
Alternatively, copy the URL link and share it via your preferred communication channel. Both options let you view the reports in real-time.
With campaign performance and recommendations in one place, it takes minutes to distill insights and speed up decision-making.
5 Best Practices for Advertising Reporting
There’s no one right way to create a performance advertising report. But in general, all effective dashboards boil down to:
(A) REGULAR MONITORING
Step in before it’s too late. Implement a tiered tracking system (e.g., monitor engagement metrics like CTR daily and conversion metrics weekly).
(B) CLEAR OBJECTIVES
Objectives set the stage in your reports.
They reinforce the client’s goal and determines how far along you are in your progress. Tip: Use the Comment widget on DashThis to include your ad objectives and results in one place.
(C) CONSISTENT METRICS
Standardize your metrics to align every stakeholder on your goals. This leads to better cross-functional collaboration and better results.
(D) ACTIONABLE INSIGHTS
Insights should drive change, not create uncertainty.
For example, “Upsell [new customer segment] with [add-on #1] to improve lifetime value” is more actionable and valuable than“Improve lifetime value”.
(E) CUSTOMIZED REPORTS
Tailor the reports by stakeholder level.
If you’re sending it to a C-suite executive, highlight metrics that impact the bottom line (e.g., ROI, total sales). For a marketing manager, focus on metrics related to campaign execution, like CTR and campaign budget allocation.
Automate Your Advertising Performance with DashThis
Start with the metrics above if you don’t know where to begin.
If you’re presenting to leadership, focus on revenue metrics like ROI, ROAS and CPL. However, if you’re reporting to marketers in charge of execution, highlight user engagement metrics like follower growth and CTR.
Managing hundreds of ads across channels is overwhelming. Fortunately, the right tools make it easier.
DashThis is the easiest marketing reporting tool. Automatically gather your entire ads data across multiple ads channels into one beautiful report. Start your free 15-day trial today.

Want to track your advertising performance seamlessly?
Read More

Don’t miss out!
Follow us on social media to stay tuned!
Automate your reports!
Bring all your marketing data into one automated report.
Try dashthis for free