Marketing Report: Definition, Examples & Templates for 2026

Marketing reports help teams understand how their marketing efforts are performing and what to focus on next.
At a high level, a marketing report summarizes performance over a specific period using key metrics and insights. It brings data from multiple channels into one place, making it easier for agencies, marketers, and executives to review results and make informed decisions without spending hours pulling reports.
That's where a good reporting tool with clear and automated marketing reports comes in.
See this report example with your own data
Because reporting needs vary by audience, marketing goals, and channels, there’s no single format that works for everyone. That’s why this guide covers what a digital marketing report includes, how to create one, and shares seven marketing report examples to show how different teams turn marketing data into clear, actionable insights.
- What is a marketing report?
- What Should a Marketing Report Include?
- What marketing report templates should you use?
- 1. General marketing report example
- 2. SEO marketing report example
- 3. PPC marketing report example
- 4. Social media marketing report example
- 5. Display advertising campaign marketing report example
- 6. Ecommerce marketing report example
- 7. Email marketing report example
- How often should you create a marketing report?
What is a marketing report?
A marketing report is a structured summary of marketing performance over a specific period, typically presented through metrics, visuals, and insights. It helps marketing teams, clients, and stakeholders understand results and make data-driven decisions.
Importantly, it lets you quickly monitor marketing performance across all your marketing channels and tells you where your digital marketing efforts are a success and where they might need to be optimized.
Marketing report vs marketing dashboard
Marketing reports and marketing dashboards are often used together, but they serve different purposes.
| Marketing report | Marketing dashboard |
|---|---|
| Summarizes marketing performance over a specific period | Designed to be shared with clients and stakeholders |
| Displays marketing data in near real time | Primarily used by internal teams |
| Includes insights, explanations, and next steps | Explains what happened and why |
| Focuses mainly on metrics and visualizations | Shows what is happening right now |
In short, a marketing dashboard helps teams monitor performance day to day, while a marketing report turns that data into insights that support decisions, planning, and communication.
What Should a Marketing Report Include?
A marketing report should focus on the marketing metrics that matter most to the business goals. At a minimum, it should include clear key performance indicators (KPIs) for each channel you’re tracking, such as website traffic, organic search, conversions, ad performance, or engagement.
Depending on your strategy, this can also include performance data from specific marketing initiatives like email campaigns, paid ads, or social media. Beyond raw numbers, a strong marketing report explains what the results mean and highlights trends or changes, so it’s easy to understand performance and decide on next steps.
Tip: want to speed up client explanations? AI Insights does the heavy lifting by analyzing your dashboard and surfacing clear insights you can share with clients, helping them quickly understand results without manual analysis.
What marketing report templates should you use?
Our monthly marketing report templates are designed to save you time regarding marketing reporting. They're preloaded with the most relevant KPIs and fully customizable so you can change them according to your or your client's requirements.
Here are 7 of our most popular marketing report templates:
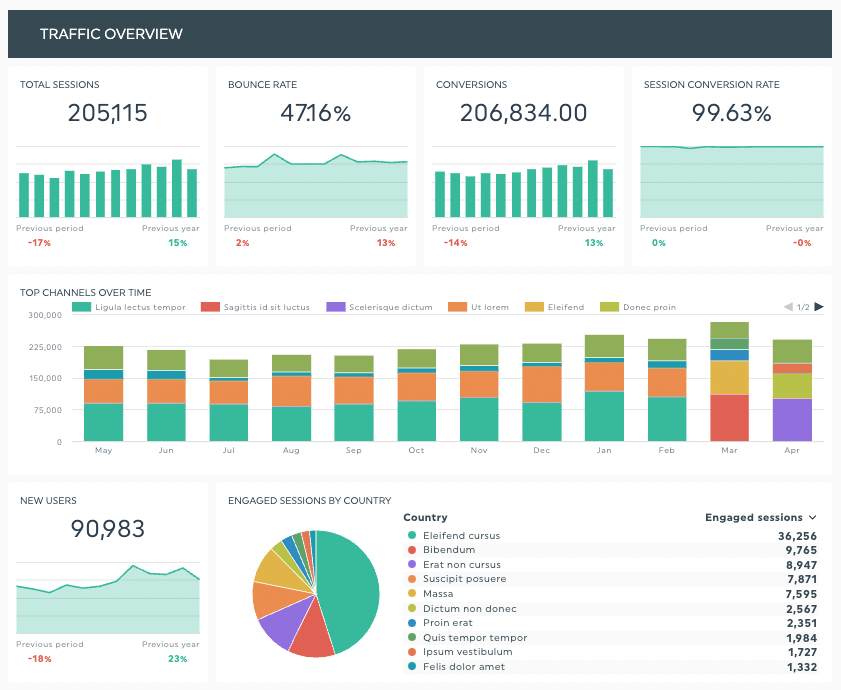
1. General marketing report example
This template gives you a high-level overview of all your marketing activities. From content marketing and e-commerce analytics to search engine optimization, it helps your marketing or sales team quickly understand overall performance across channels.
Because this is an overview report, it’s best used for spotting trends and high-level performance. If you want to dive deeper into specific metrics, the more specialized report examples below are a better fit.
Some KPIs we recommend including are:
- Bounce rate
- Campaign performance
- Channel performance by traffic source (website traffic, organic traffic, paid traffic, referral traffic)
- Conversion rate
- Goal completions
This type of marketing report helps you decide:
- Where to allocate marketing budget across channels
- Which marketing channels need optimization
- What to prioritize next month
Use this report with your own data!
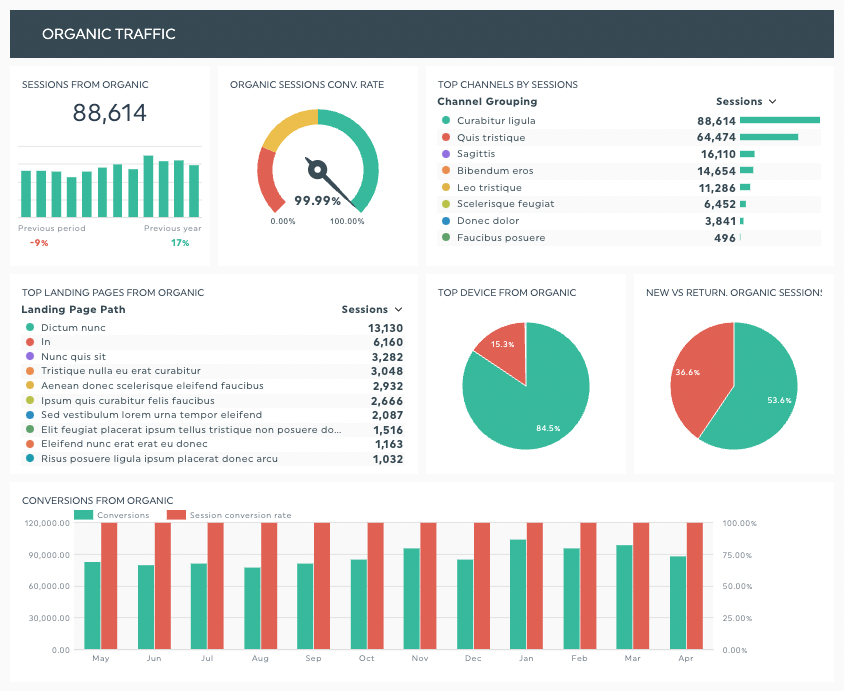
2. SEO marketing report example
SEO is a key part of any long-term digital marketing strategy. This report helps you and your clients understand how your SEO efforts are performing over time, beyond what you might see in individual Google Analytics dashboards. It brings SEO data together in one place so results are easy to review and explain.
Key KPIs you should think about including in your SEO report include:
- Organic sessions
- Organic conversions
- Organic landing pages
- Keyword rankings
This report helps you decide:
- Which pages and keywords drive the most organic traffic
- Where SEO opportunities or drops need attention
- How to prioritize SEO efforts for the coming months
Try this report with your own data!
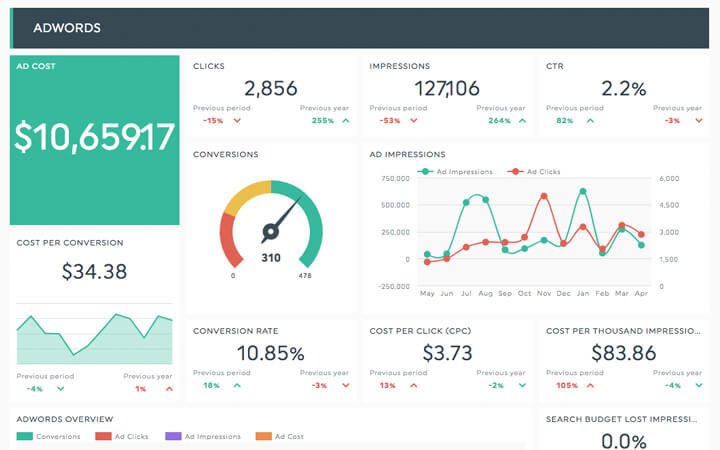
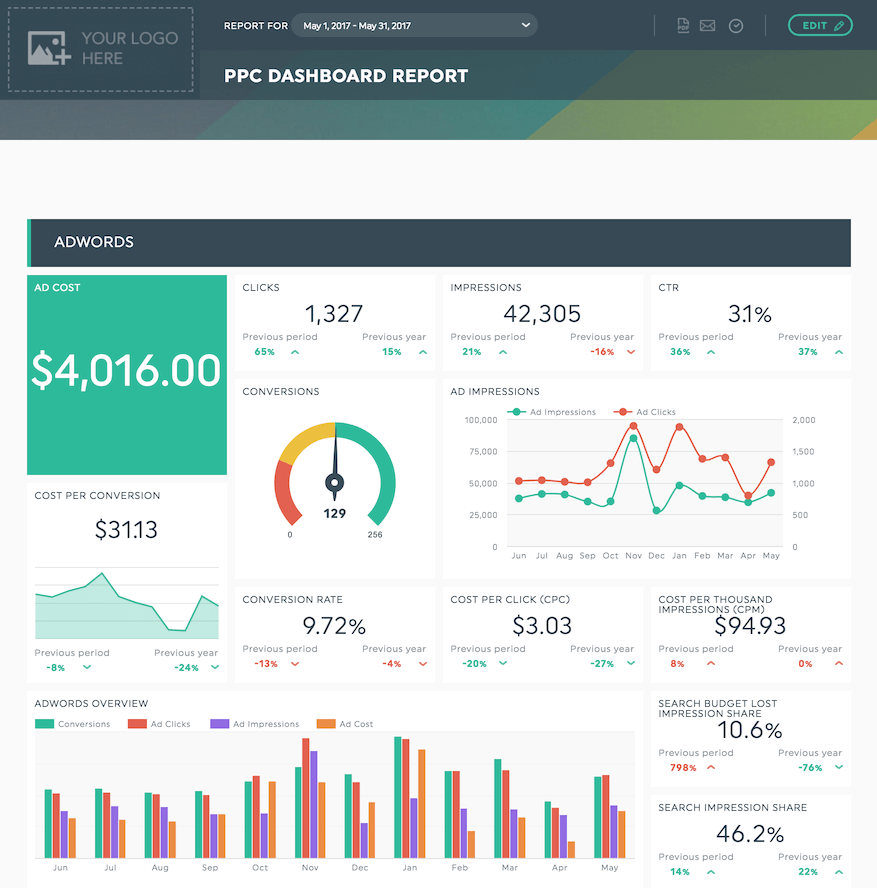
3. PPC marketing report example
PPC is one of the easiest channels for tracking return on investment, but performance only improves when results are monitored and optimized regularly. A PPC marketing report brings paid advertising data into one place, making it easier to understand what’s driving conversions and where spend can be adjusted.
This type of report typically supports platforms like Google Ads, Facebook Ads, Bing Ads, SEMrush, and more, giving teams a clear view of paid performance across channels.
A good PPC marketing report will include stats on:
- Number of leads
- Revenues
- Clicks and costs
- Conversions
- Ad performance
We also recommend organizing your data by channel to get a breakdown of how each one is performing.
This report helps you decide:
- Which campaigns and ads deliver the best ROI
- Where to increase, reduce, or reallocate ad spend
- Which platforms need optimization to improve conversions
See this report with your own data!
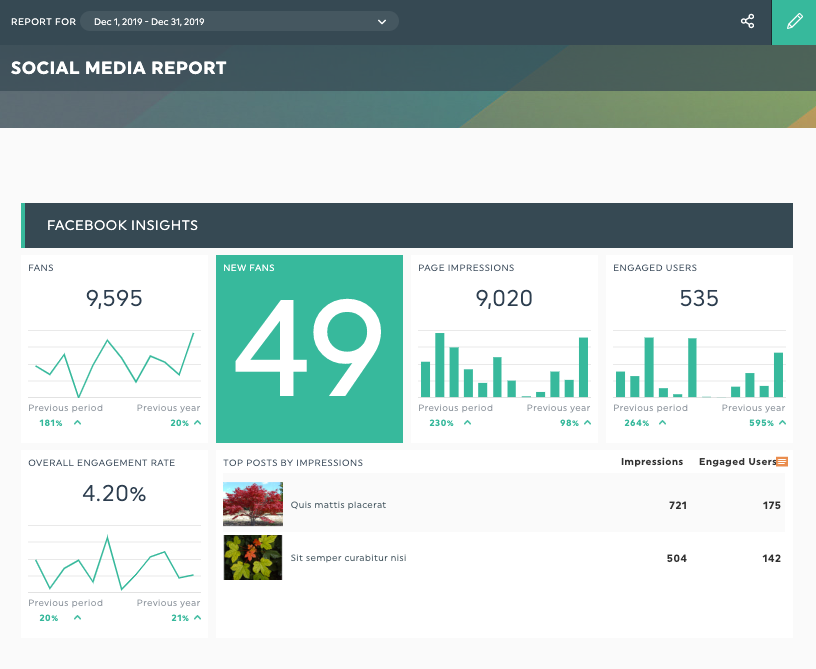
4. Social media marketing report example
Social media marketing includes both paid efforts (such as social ads) and organic activities like content and community building. A social media marketing report brings performance from all active platforms—such as Facebook, TikTok, X (Twitter), Instagram, YouTube, and LinkedIn—into one place, making it easier to understand what’s resonating with your audience.
Key KPIs that should be in your report are:
- Demographics of the target audience
- Likes and followers
- Impressions and reach
- Engagement rate
- Top performing posts
As with PPC marketing, the data in the report should be organized by social media platform for a clearer overview.
This report helps you decide:
- Which platforms and content types perform best
- Where to focus organic efforts versus paid promotion
- What to adjust in your social strategy to improve engagement
Use this report with your own data!
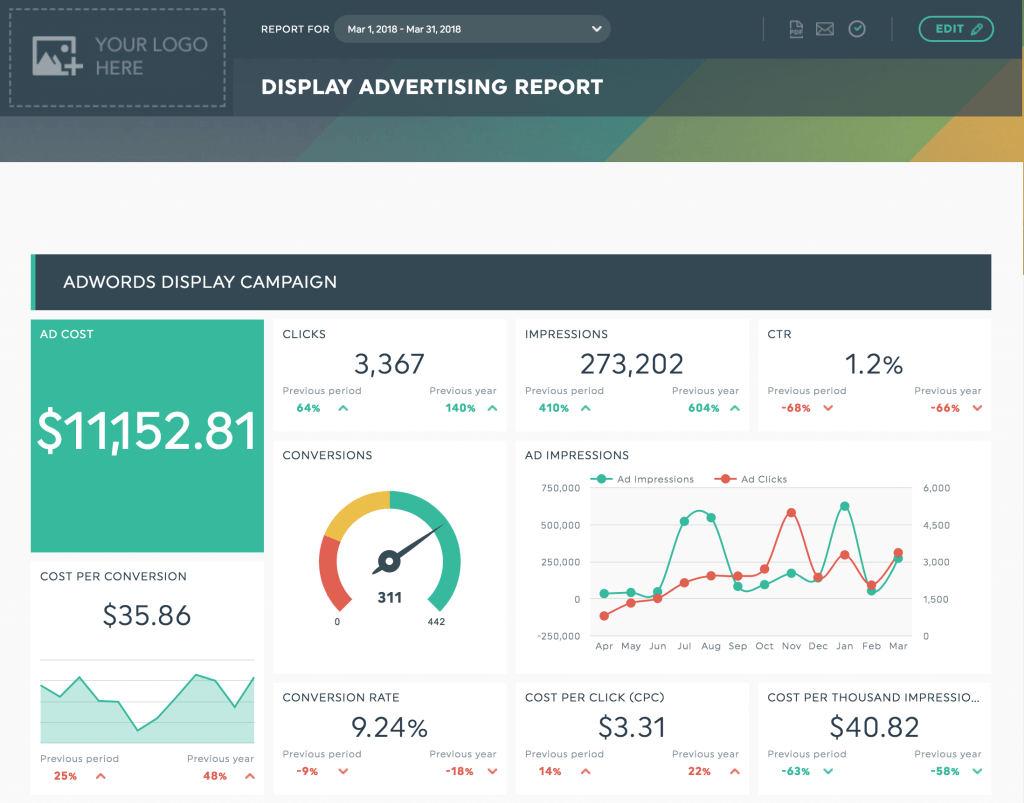
5. Display advertising campaign marketing report example
Bring all your advertising campaigns into one marketing report for a complete view of their performance with our display advertising campaign marketing report.
Whether using Facebook Ads or Google AdWords, this report should include all your display ad channels.
Your data should be organized by campaign and you should track the following KPIs for each campaign:
- Clicks
- Cost and cost per click
- Click-through rate (CTR)
- Impressions
- Conversions
This report helps you decide:
- Which campaigns generate the most value
- Where to adjust budgets or bidding strategies
- Which ads or audiences need optimization
Use this report with your own data!
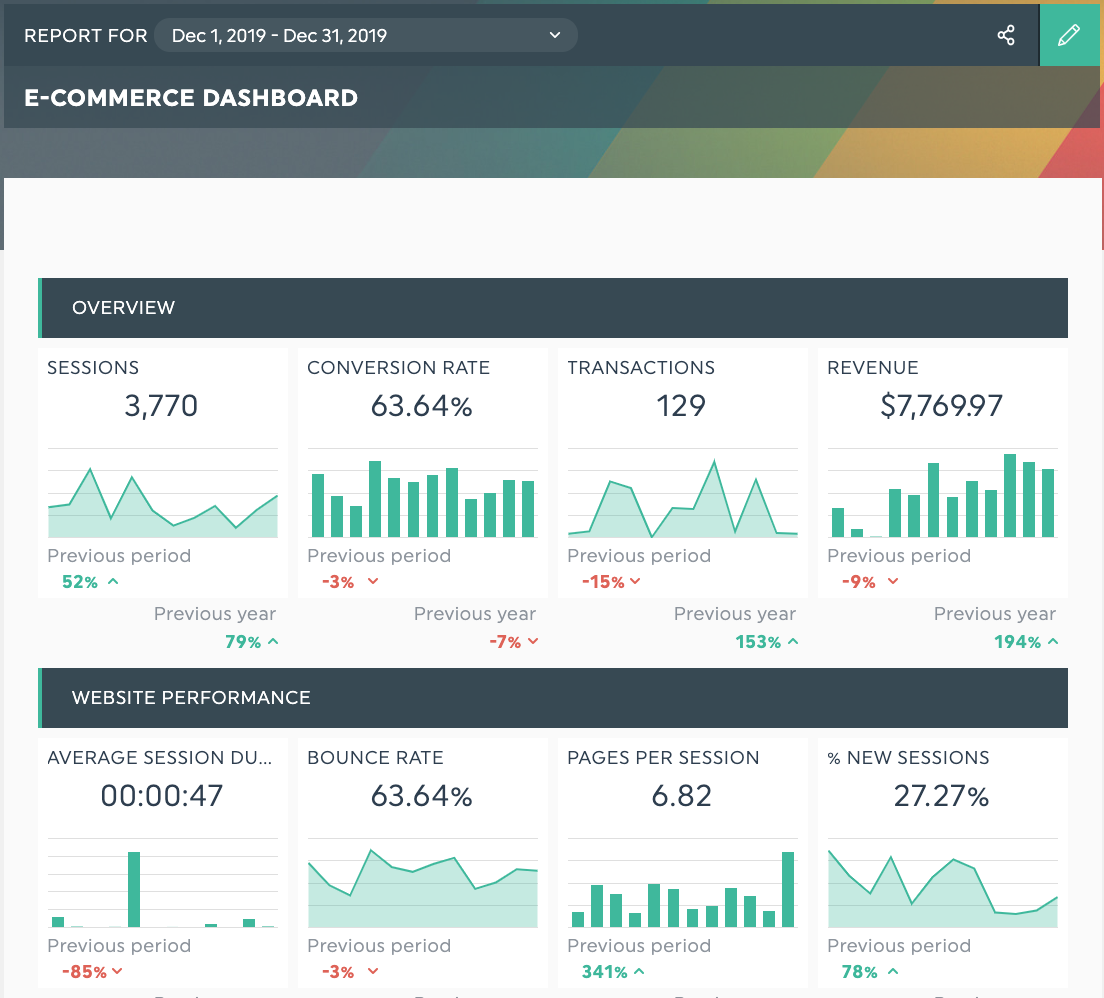
6. Ecommerce marketing report example
As your products and services evolve and change, so should your e-commerce marketing strategy. Our e-commerce marketing report includes all the main KPIs you'll want to track to ensure you get the best possible results from your e-commerce marketing efforts.
Ecommerce marketing involves several marketing channels, from Google Analytics to social media, so there's no shortage of important metrics to track.
- Revenue
- Conversion rate
- Transactions
- Bounce rate
- Pages per session
- Average order value
This report helps you decide:
- Which channels and campaigns drive the most revenue
- Where shoppers drop off in the purchase journey
- What to optimize to increase conversions and average order value
View this report with your own data!
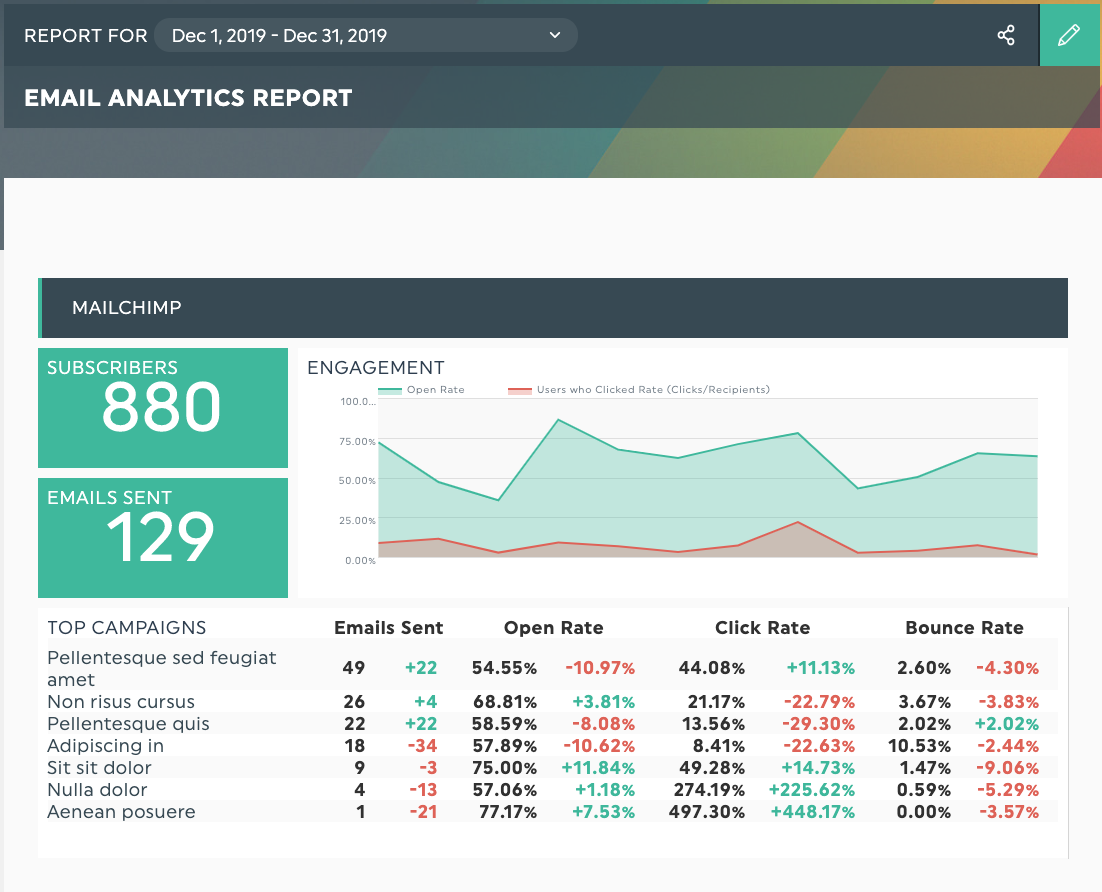
7. Email marketing report example
Email marketing is a direct way to reach your audience, but performance only improves when campaigns are measured and optimized. An email marketing report brings campaign results into one place, making it easier to understand how email content and timing impact engagement and conversions.
Rather than sending emails and hoping for the best, this report helps teams track performance and connect email results to business outcomes.
That's where our email marketing report comes in.
KPIs your report should include are:
- Number of emails sent
- Unique open rate
- Click rate
- Overall campaign performance
This report helps you decide:
- Which email campaigns drive the most engagement and conversions
- What content or messaging resonates with your audience
- How to optimize future email campaigns to improve results
Fundamentally, you want to track how many people opened your email and converted.
Use this report with your own data
How often should you create a marketing report?
Most teams create marketing reports on a monthly basis, as this cadence offers the best balance between insight and clarity. Monthly reports provide enough data to spot trends, evaluate performance, and understand the impact of changes without overwhelming stakeholders.
In some situations, daily reports or weekly marketing reports can be useful, especially for monitoring active campaigns or short-term optimizations. That said, sharing reports too frequently can lead to information overload, causing clients or executives to disengage and miss key takeaways.
Using a marketing reporting tool like DashThis makes it easy to adjust reporting frequency without additional work. Whether you review performance daily, weekly, or monthly, reports can be set up once and updated automatically, so teams spend less time reporting and more time acting on insights.
Marketing reports built for marketers
Creating effective marketing reports doesn’t have to be time-consuming or complex. DashThis has a bunch of other report templates that cover pretty well every aspect of digital marketing. All of them make reporting on marketing campaigns quicker and easier: data is pulled in automatically, eliminating manual work in spreadsheets or slide decks and keeping reports up to date at all times.
DashThis is designed to be simple and flexible. Reports can be customized using drag-and-drop widgets, then automatically shared with clients or stakeholders on a schedule that fits your workflow. The result is faster reporting, clearer insights, and more time to focus on strategy.
And if you ever wish your reports could explain the results for you, DashThis AI Insights does exactly that. It analyzes your dashboards and highlights key takeaways, changes, and opportunities, making marketing analytics easier to understand and act on.
Marketing analytics made easy! How fun is that?
Ready to save some time? Try out DashThis free for 15 days.

Try creating your own marketing report with Dashthis!
Read More

Don’t miss out!
Follow us on social media to stay tuned!
Automate your reports!
Bring all your marketing data into one automated report.
Try dashthis for free